Education
December 2, 2020

Copper is trading at its best level since March 2013 and has rallied 7 of the last 8 months. Be aware of the 61.8% retrace of the decline from the 2011 high at 3.6130 for possible resistance. Considering that ‘everything’ is going up against the USD, this level could prove important from a multi-asset perspective.
November 23, 2020
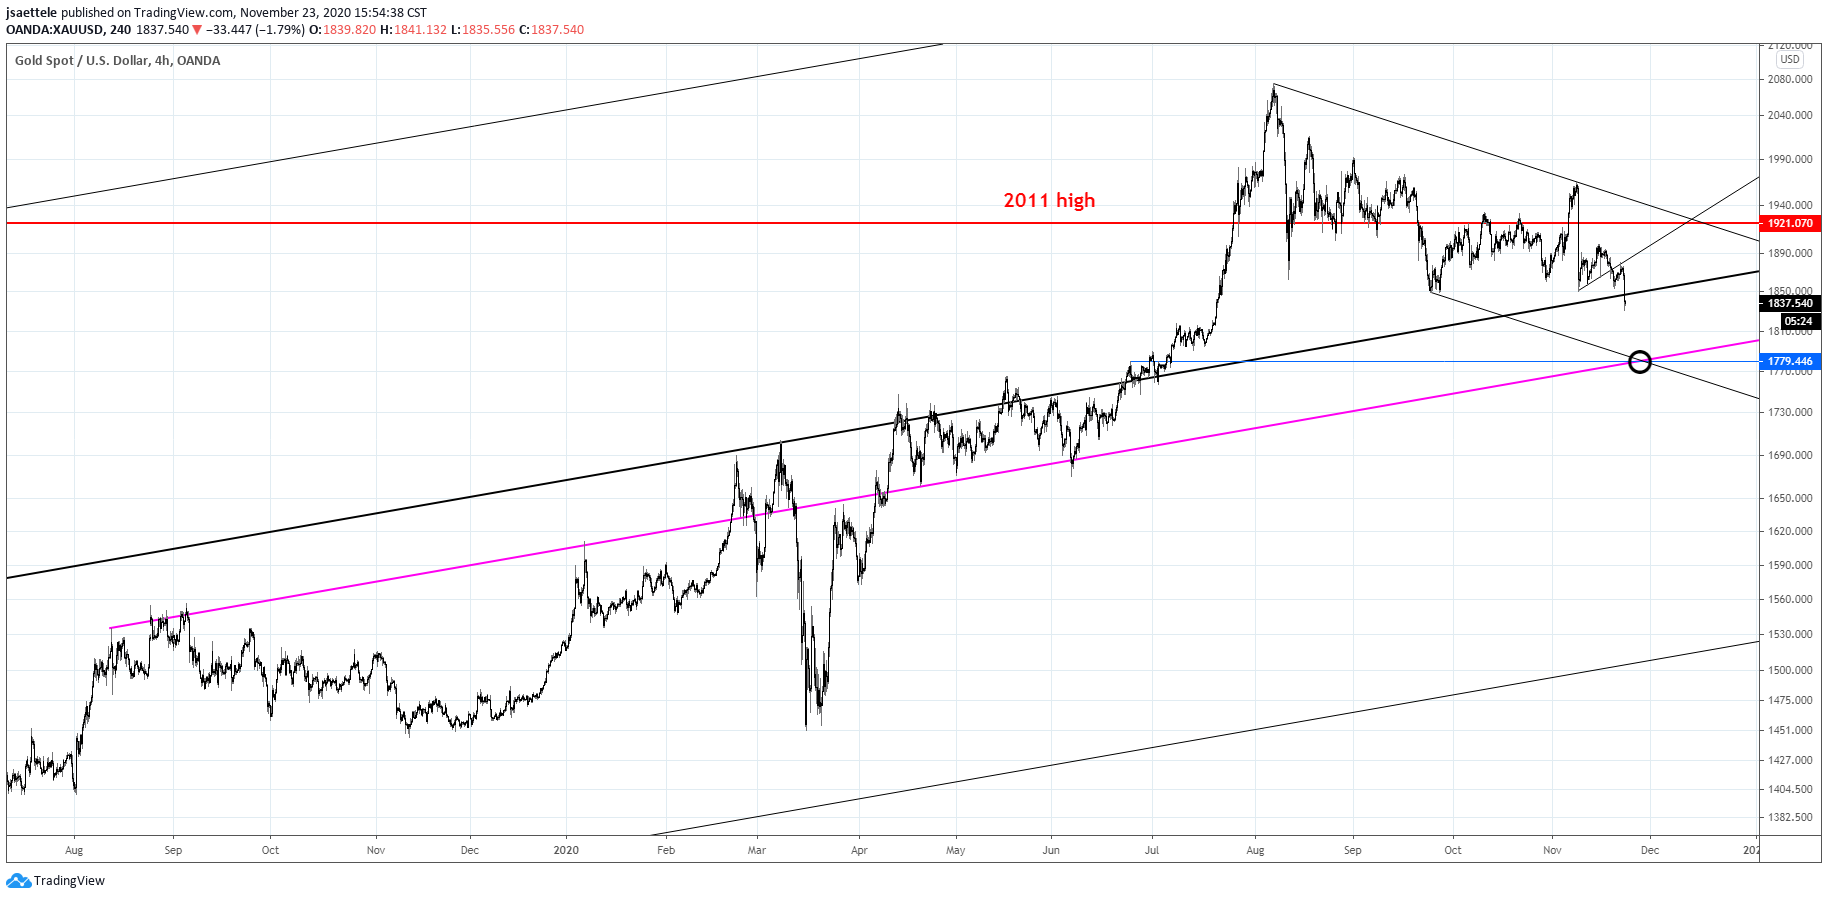
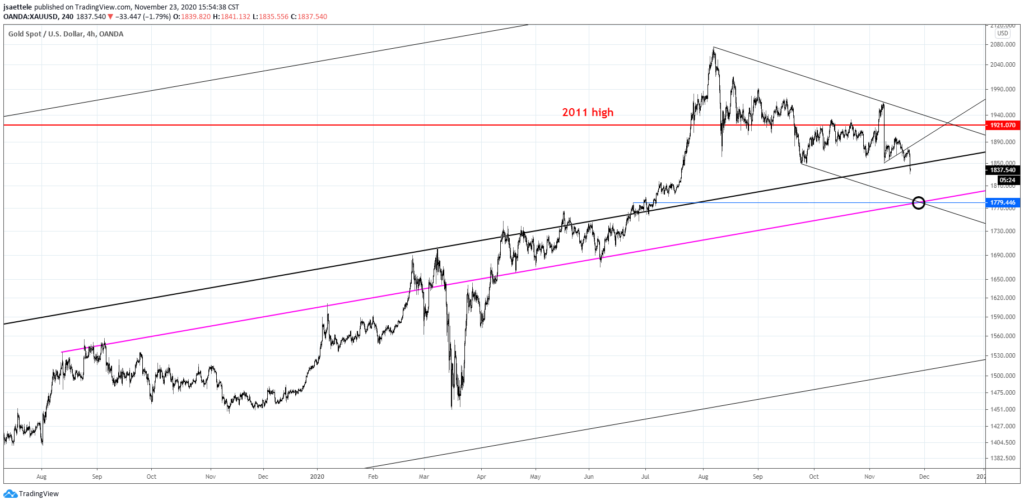
Gold tagged proposed resistance on Friday and dumped today…beautiful. Price is quickly approaching the long held support near 1780. This level is an important parallel and the lower channel line from the bearish channel off of the August high. I’ll be paying close attention to 1780 for reversal evidence.
November 18, 2020

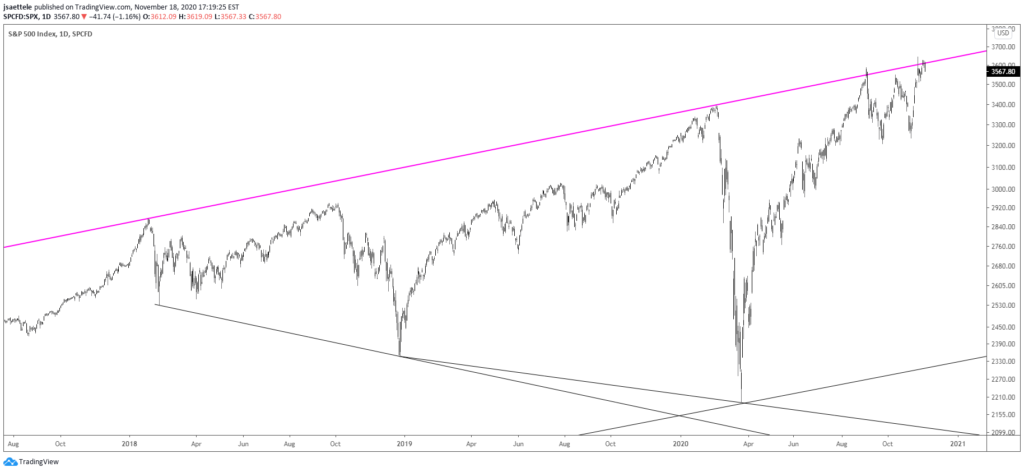
Neither SPX or the Nasdaq have broken above their reversal day highs from last week (11/9). What’s more, SPX has reversed yet again from the line that connects highs since 2018. Don’t forget that this line crosses major pivots for the last 88 years (monthly chart is below). U.S. equity valuation is at a peak as well (see 2 charts down).
November 11, 2020

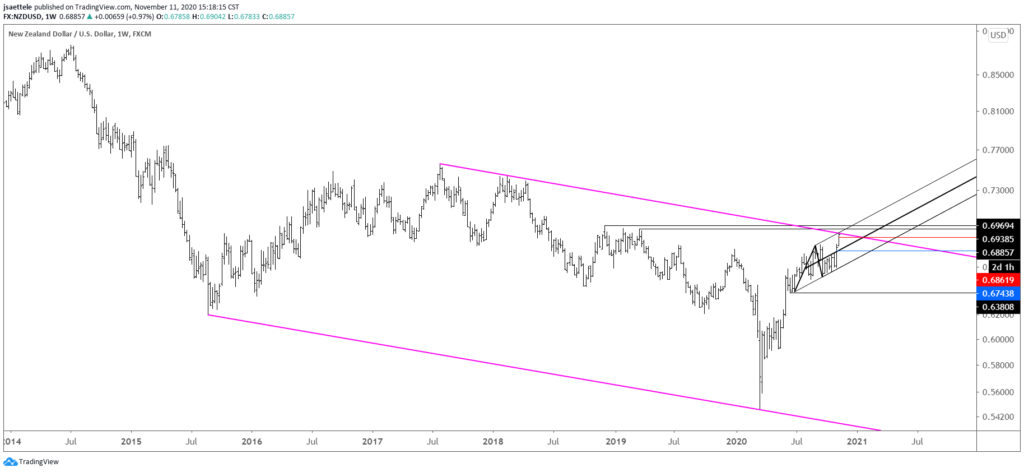
NZDUSD has ripped into the confluence of long term downward sloping channel resistance and short term upward sloping channel resistance. I’m interested in the short side IF we see some reversal evidence over the next 2 days (rest of the week). A drop below the high volume level from RBNZ at .6862 would be an early sign of a reversal.
November 4, 2020
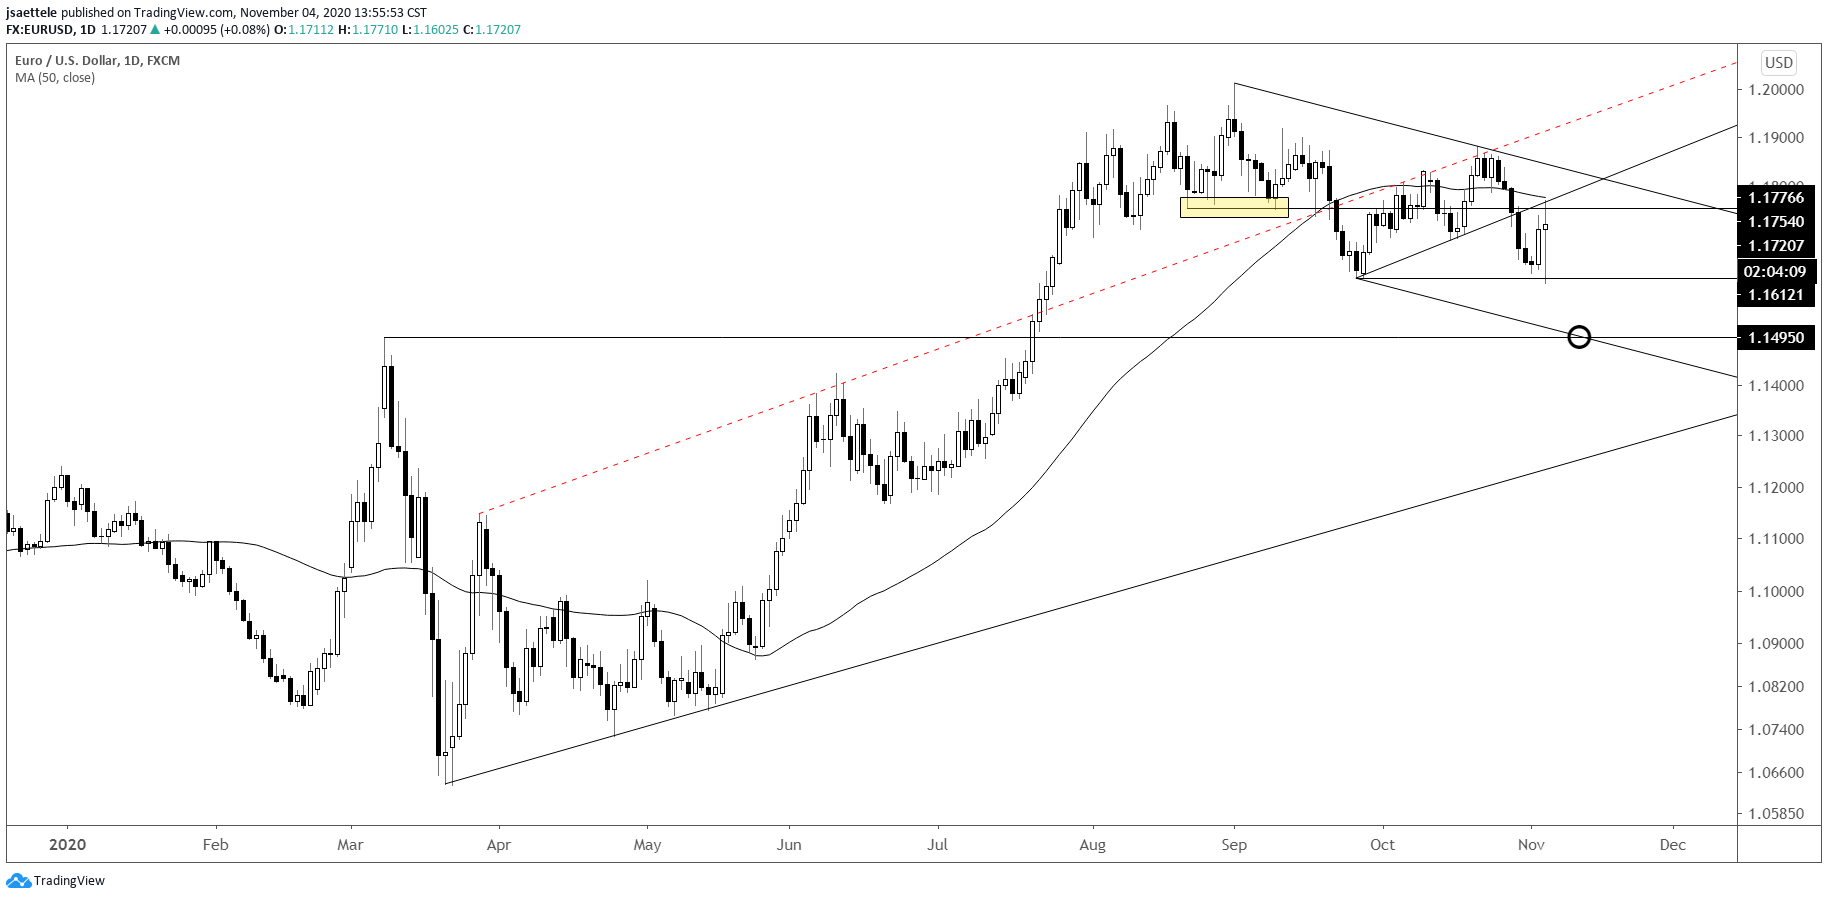
EURUSD traded into resistance as early polls closed, tanked to its lowest since 7/24 and then ended the day unchanged. So 2020. Bottom line, resistance was hit so I favor the short side. Weakness below 1.1700 (most recent high volume level and support in August and October) would warrant taking a shot.
October 29, 2020

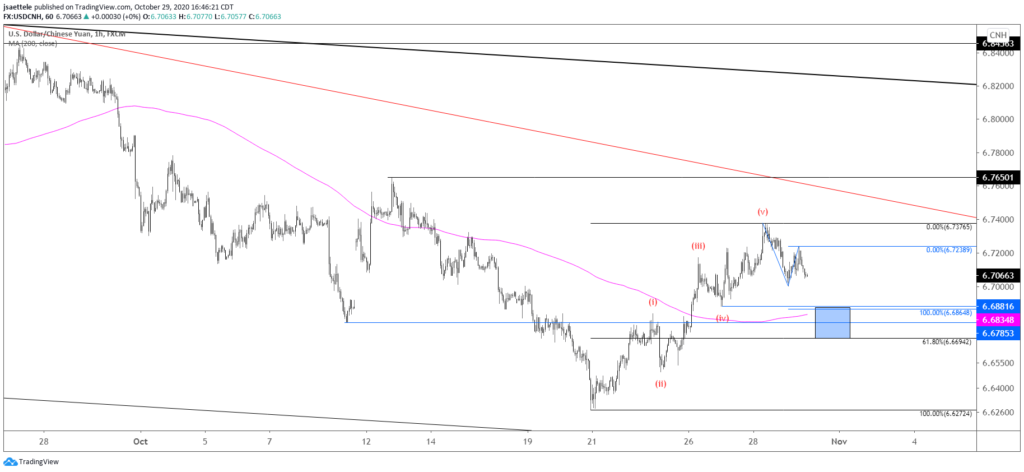
The USDCNH, DXY non-confirmation nailed the turn again. Upside is favored for the USD over the next few weeks but there are reasons to suspect that the USD pulls back slightly (so maybe a bounce in equities too). USDCNH pattern is one of those reasons. The rally from the low is in 5 waves so expectations are for a 3 wave pullback. That pullback is underway. The proposed support zone is 6.6690-6.6880.
October 28, 2020

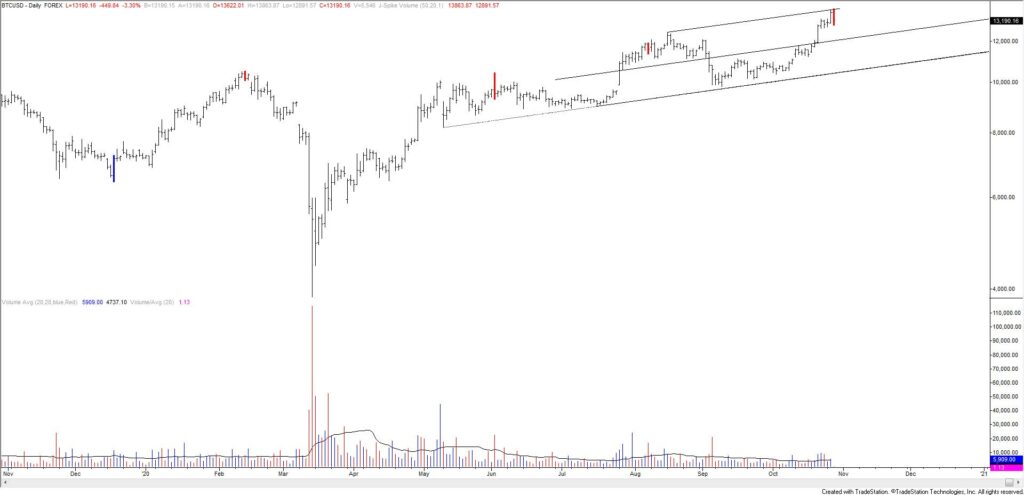
Bitcoin made a volume reversal today. The high was right at the top of a channel too. The longer term chart is extremely bullish but price could drop to back to 10,000 or just below and still be bullish on a longer term basis. Near term, the BTCUSD reversal lower doesn’t bode well for ‘risk assets’ in general. No, BTCUSD is not a ‘safe haven’. It’s been moving with everything else all year. The ONLY safe haven in the current environment is the USD (maybe Yen and US treasuries too).
October 23, 2020

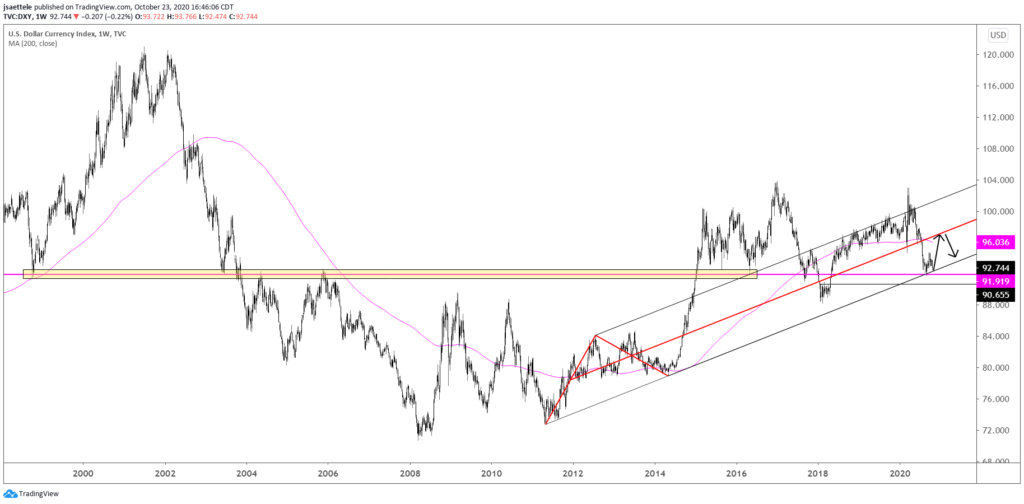
2011-2014 trendline support in DXY held in September. Focus is higher as long as price is above that level. 96-97 is a general zone to look towards. This zone includes the 200 week average and center line of the channel from the 2011 low.
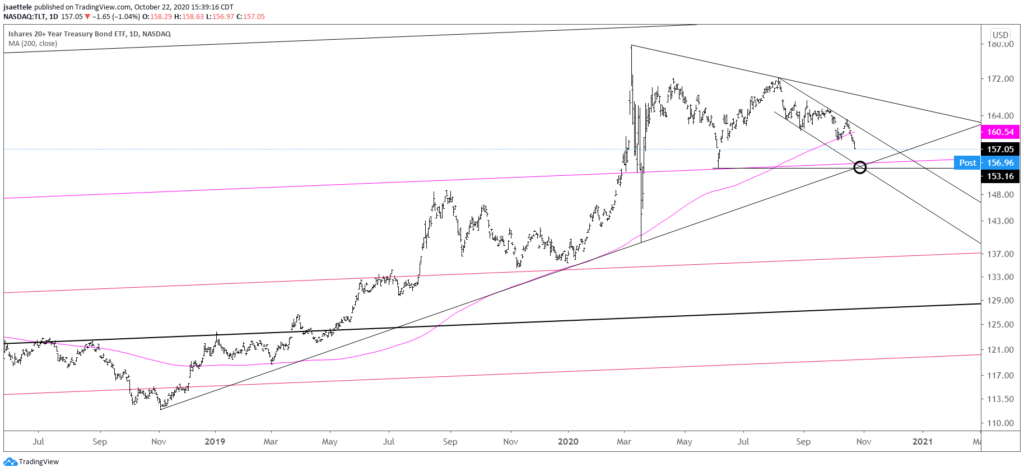
October 22, 2020

Bonds have been the big mover leading up to the U.S. election. TLT is under the 200 day average for the first time since December 2018. The next critical level to pay attention to is 153-154. This is the bottom of a short term channel, the June low, and the long term upper parallel from the channel that originates at the 2007 low (magenta line). The upper parallel nailed tops in 2012, 2015, and 2016 and the low in June. A long term chart is below. Expect the level to act as support BUT a break below would indicate a major behavior change in TLT (and bonds generally).