Education
January 6, 2022

ETHUSD has broken the line described yesterday (magenta line). This line is resistance if reached near 3640. Price is testing the 200 day average now (not shown) but the more important level is probably VWAP from the May 2021 high at 3050 (see below). Bigger picture, my view is that price drops to 985 or so in a 4th wave.
December 23, 2021

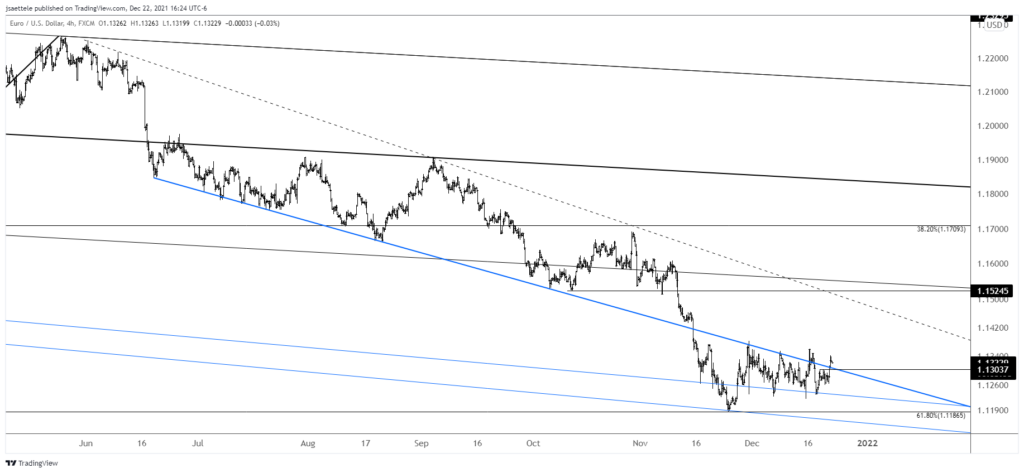
EURUSD is once again flirting with an important breakout above the trigger line. Price is more or less right at the line now. Again, a break above is needed in order to indicate an important behavior change. Ideally, price rises a bit more before pulling back to the line near 1.1300 and holding it as support. That’s the setup at least! Near term upside remains about 1.1520.
December 21, 2021

Cable remains above the high, although barely. I continue to ‘think’ higher in GBPUSD given the well-defined price level that price is hovering above. Again, this is VWAP from the March 2020 low and channel support. There is also the high from March 2020 and the 38.2% retrace of the rally from March 2020. Finally, there is RSI divergence on the 4 hour chart. Magenta dots in the chart below show divergent readings over the past year.
December 17, 2021

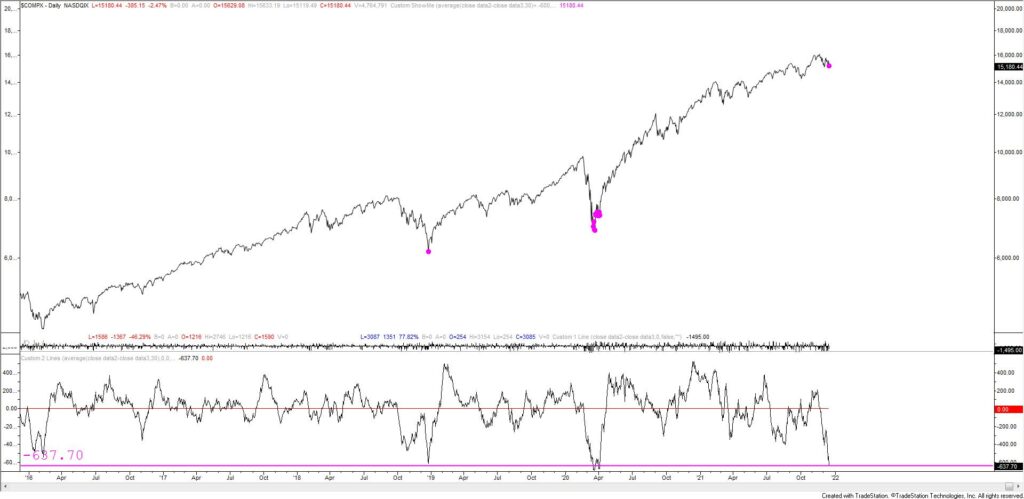
The equity ‘market’ has felt odd recently. A look beneath the surface confirms this suspicion. The 30 day Nasdaq advance-decline line is plotted below the composite index. The AD line closed at -637 today. The magenta dots indicate readings of -600 or lower. Previous readings this occurred at the Dec 2018 low and for several weeks in March-April 2020 (the first reading was 3/18/20). Prior to the last few years, readings this low occurred in October-November 2008 and during the 2000-2001 decline! Those periods are shown in the charts below. So, the A-D line is ‘oversold’ yet the QQQ closed a bit more than 5% off of the all time high today. All of the prior ‘extreme’ AD readings occurred after for more meaningful declines. The only takeaway I have is that if the index continues to decline but the A-D line improves then look out below because the next low won’t be until the next extreme A-D reading.
December 2, 2021

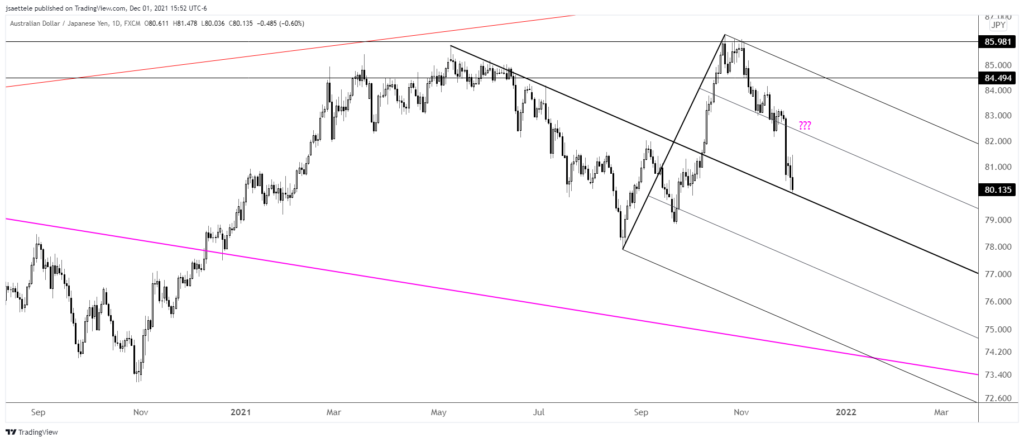
AUDJPY is the ultimate risk barometer. As usual, it’s WAY ahead of the equity market (the equity market is always the last to know). Price has reached the median line of the fork that originates at the May high. This is a good spot for a bounce and 82.40 is well-defined for resistance. This is the 25 line, which was support on 11/10. Ultimately, a downside objective is near 74 (see below).
November 23, 2021

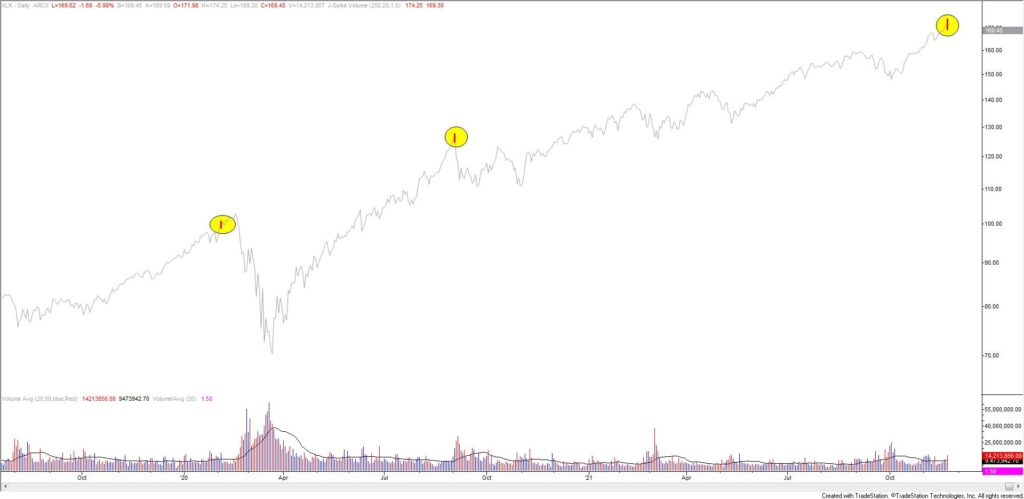
Is this the ‘Powell top’? XLK (tech ETF) made a daily volume reversal today and Nasdaq futures (see below) topped a few ticks under channel resistance. This channel was resistance for the September top. From a very big picture perspective, I’ll note that the market cap of the 5 largest companies as a percentage of the S&P 500 is extreme (see 2 charts down). The 5 largest companies are all tech companies by the way. In other words, it’s a highly concentrated market. Historically, this is unsustainable.
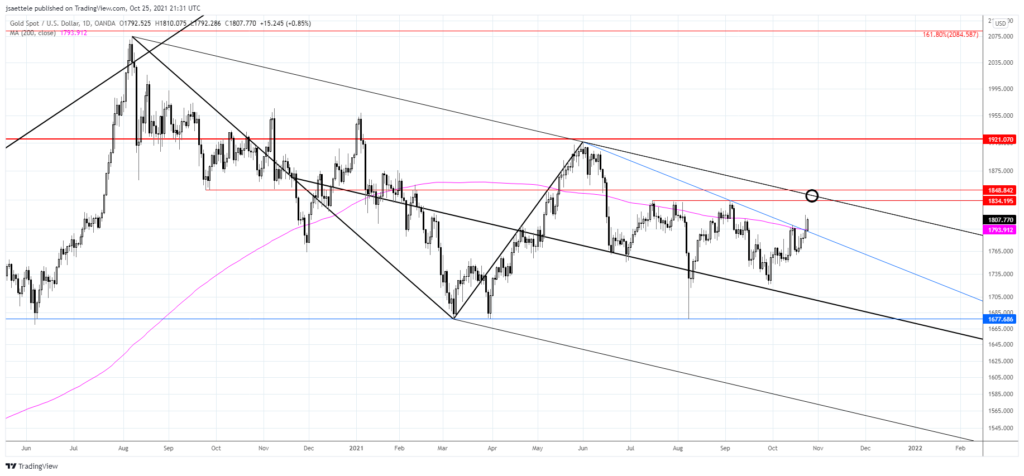
October 26, 2021

Gold broke above trendline resistance and the 200 day average today. The top side of the trendline (blue) is now proposed support near 1790. Upside focus is the line off of the August 2020 and June high. That’s about 1840.
October 5, 2021

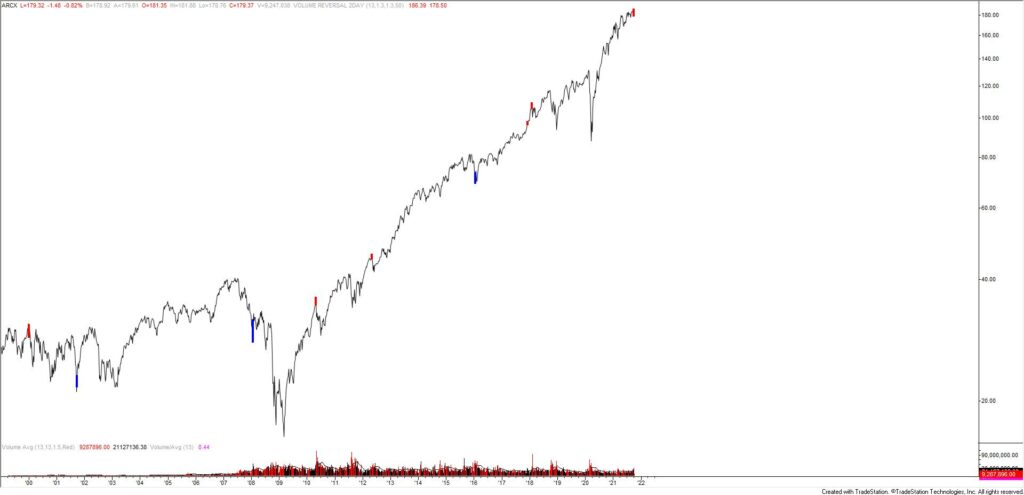
XLY is the consumer discretionary ETF. This two largest holdings are AMZN (22.9%) and TSLA (13.5%). In other words, this is an important ETF with some big names. Last week, both a 2 week volume reversal and 1 week volume reversal triggered. The 2 week signals are shown in the chart below. The 1 week signals are shown 2 charts down.
September 30, 2021

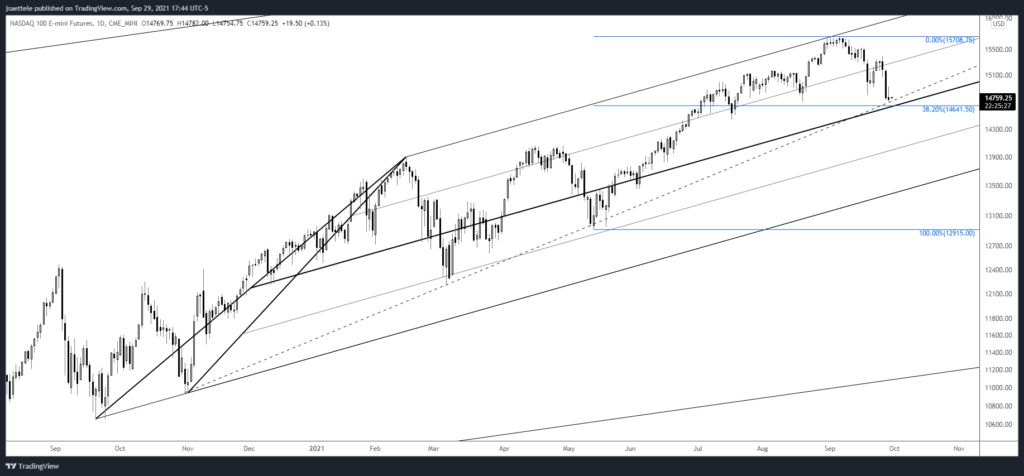
NQ is nearing the trendline from the November low. This is also the center line of the channel from the September low (the upper parallel was resistance so it would be ‘natural’ for price to react to the center line) and the 38.2% retrace of the rally from the May low (14641.50). Bottom line, this is an important test for NQ and a break below would indicate an important behavior change.