Education
January 14, 2021

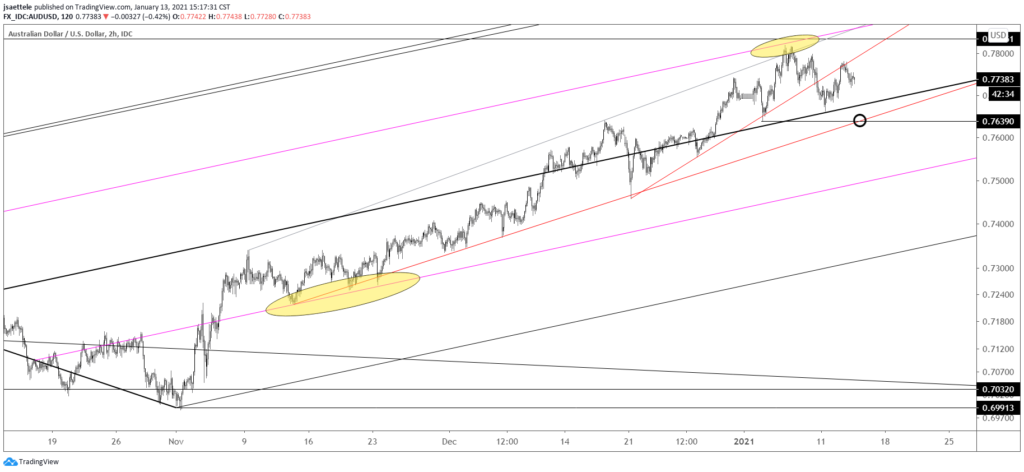
AUDUSD resistance registered at the underside of a short term trendline. The breakdown level is .7640. A drop below would open up the 25 line within the Schiff fork off of the March low. A zoomed out chart is below. Notice how the 25 line was support (in November) and the 75 line was just resistance. The concept of symmetry at work!
January 13, 2021

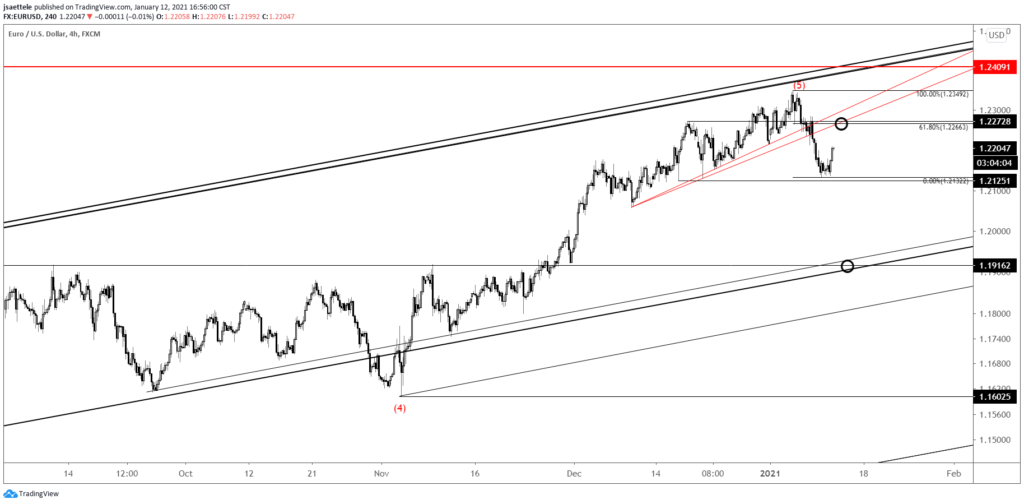
EURUSD has indeed bounced from near 1.2125 (low is 1.2132). The 61.8% retrace of the decline is 1.2266, which reinforces 1.2270 or so as resistance. 2021 VWAP is also 1.2266 (see below)! Notice that VWAP was resistance following the NFP spike last Friday. Bottom line, I’m on alert for a lower high near 1.2270.
January 12, 2021

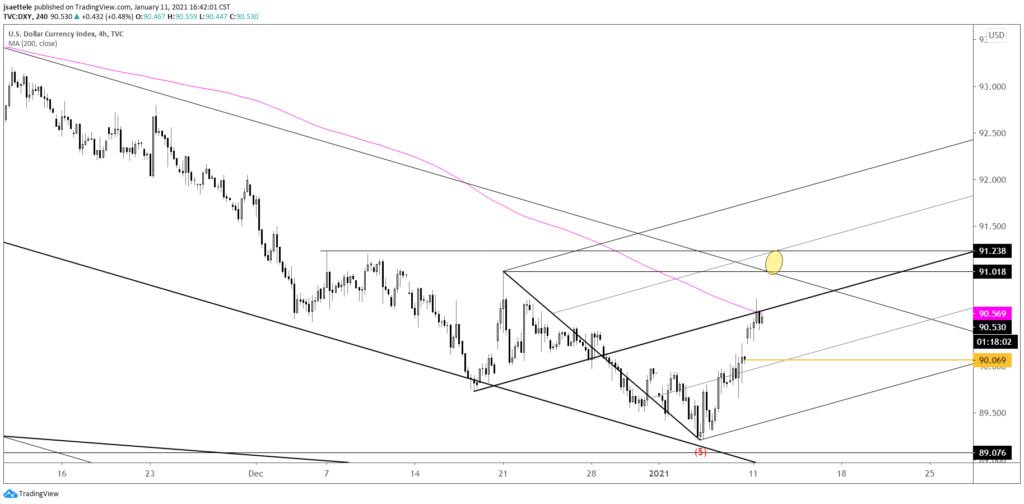
DXY has reached a possible pausing level. The level in question is defined by the 200 period average on the 4 hour chart and the median line from the structure that originates at the 12/17 low. If price does pull back, then I’ll zoom in to identify possible support. If price zooms through this level then the top side of the median line becomes proposed support.
January 11, 2021

EURUSD is breaking down and focus is on 1.1915 or so. The underside of the just broken trendline near 1.2270 is now proposed resistance. 1.2125 is a possible bounce level.
January 8, 2021

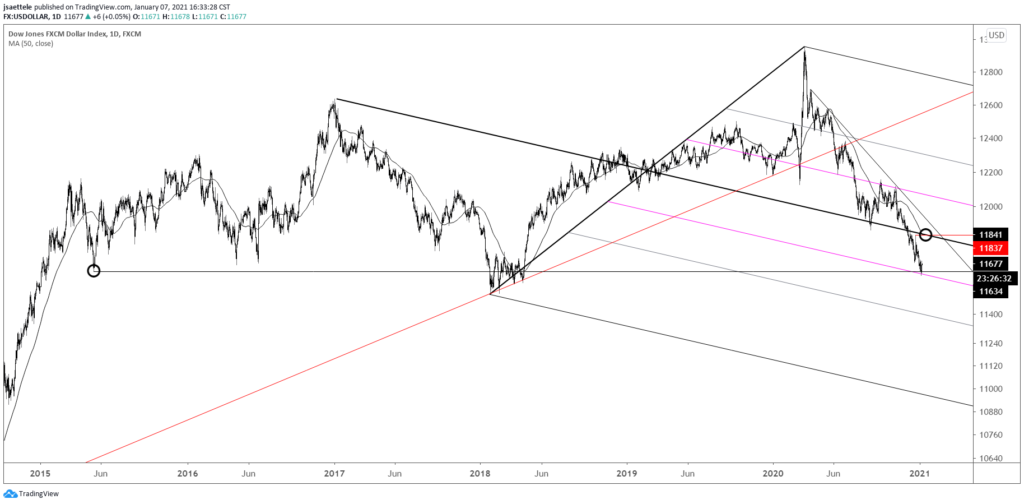
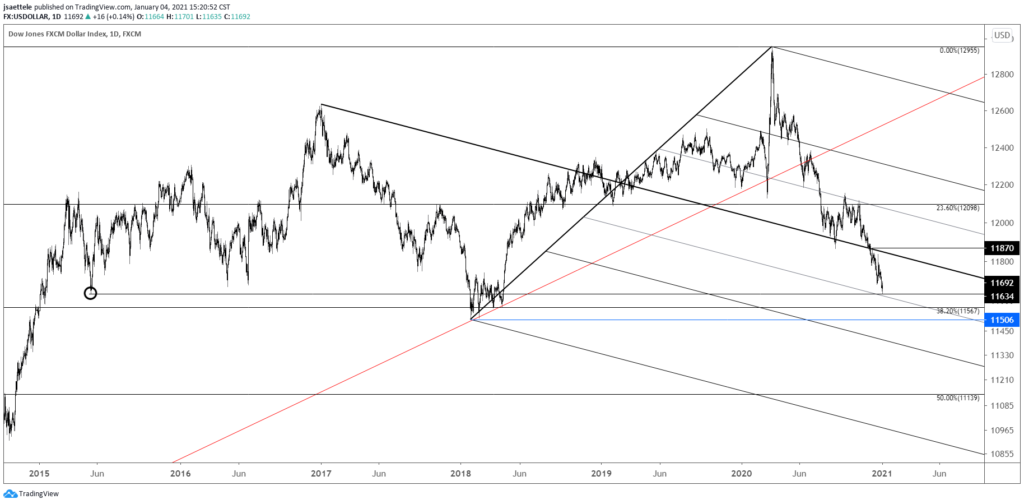
USDOLLAR continues to hold the May 2015 low. The level is also defined by a parallel that is equidistant from the parallel that was resistance in September and November (magenta lines) when measured from the median line. This is an example of symmetry that we often see in median line analysis. I am looking towards the median line, about 11840, as long as the low holds. A short term structure is shown below that is in play and worth following. 11650 is possible support.
January 7, 2021

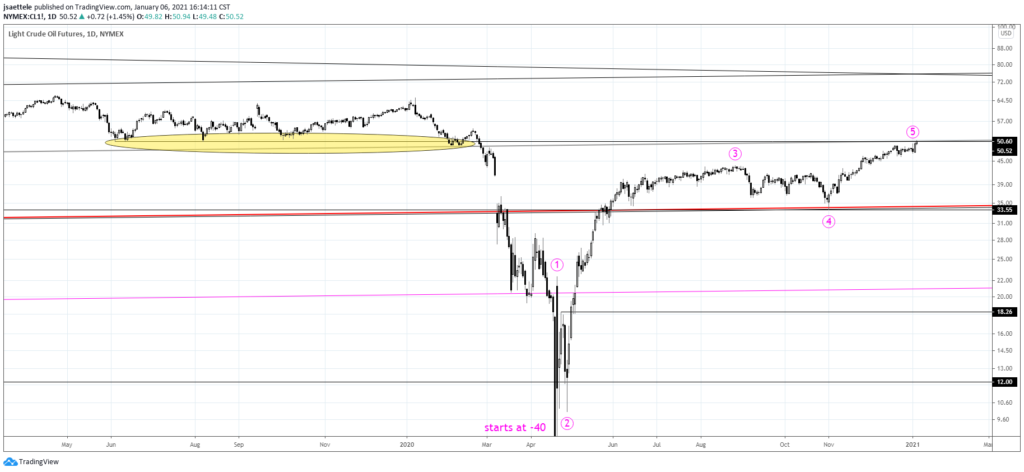
50-51 is big for crude. This zone was critical support in 2019. Once the level broke early last year, crude went into a swan dive. As noted 2 days ago, the rally from the April negative print does compose 5 waves. 5 waves up plus a massive market level in the form of former support (turned resistance?) indicates reversal potential.
January 6, 2021

Bitcoin! There aren’t enough superlatives to describe the recent rise. That said, pay attention at this level. Yesterday (first trading day of the year), BTCUSD completed a 2 day volume reversal. This means that the price rallied on significant volume and declined on significant volume the very next day. BTCUSD price history on TradeStation starts in August 2011 so this ‘study’ is in no means exhaustive. Still, the only other 2 day volume reversal occurred at the June 2019. Price is also at the top of an extremely steep channel so I’m on alert for something else besides parabolic rally.
January 5, 2021

Today’s USDOLLAR low…11635. Price reversed sharply higher after low print. UUP, the USD ETF, made a high volume reversal today. The only other volume reversal on the first day of the year was in 2017, which was a high. This is only the 4th bullish reversal since inception of the ETF. The previous 3 worked. Those charts are below.
December 30, 2020

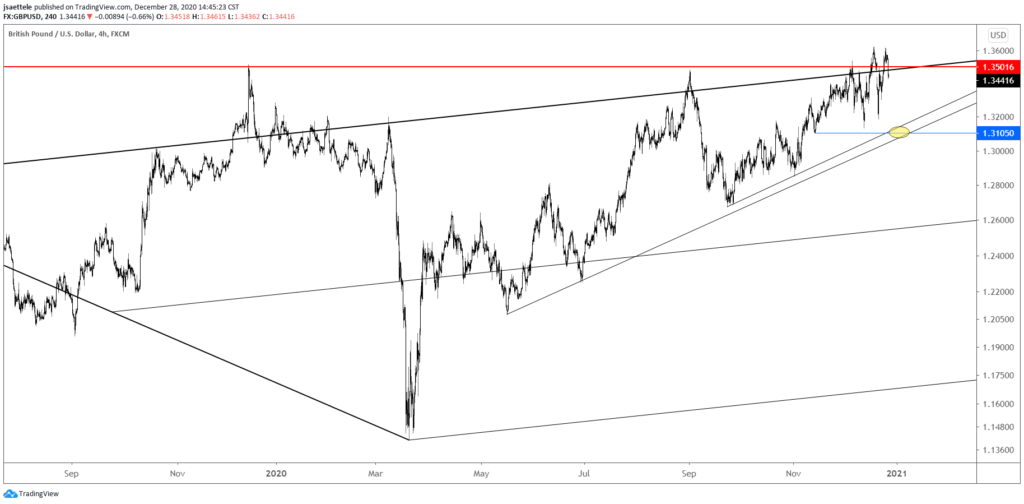
GBPUSD continues to oscillate around the critical 1.3500. A gap higher on perceived positive Brexit news was followed by weakness throughout the day…a classic ‘sell the news’ dynamic. 1.3500/25 remains proposed resistance. The top of this zone is a high volume level. Near term focus remains towards 1.3100ish. The level is defined by trendlines and is just under the 12/11 low.