Education
November 9, 2021

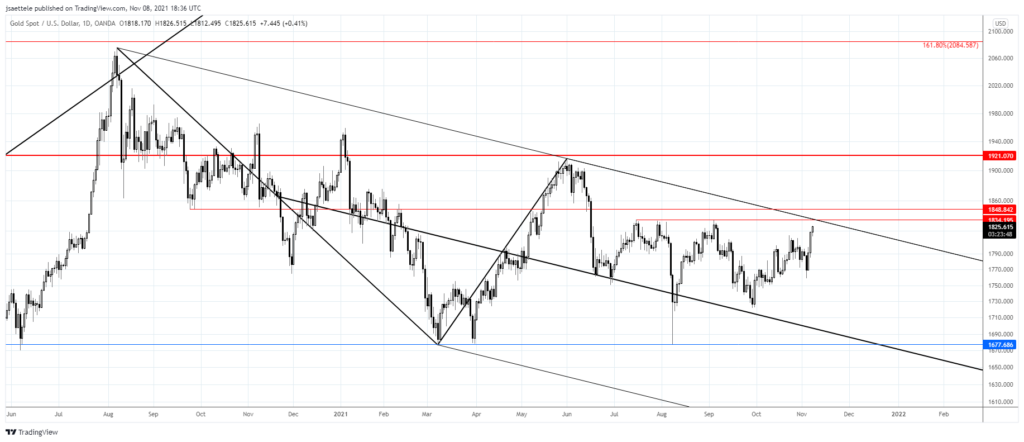
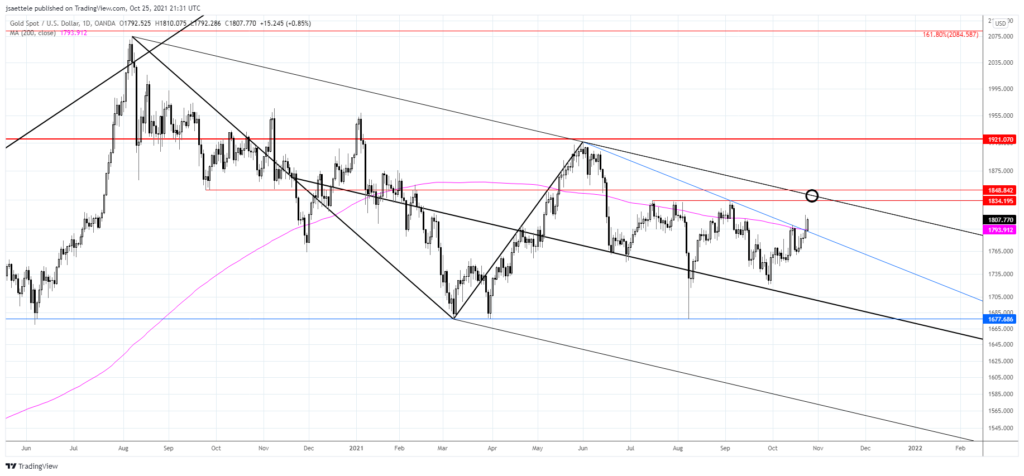
Gold is closing in on the noted level from the line that extends off of the 2020 and May highs and resistance since July near 1834. I’m ‘thinking’ pullback initially from the well-defined level but will be tracking for support beginning near 1800 since I’m of the mind that the broader trend is higher.
November 5, 2021
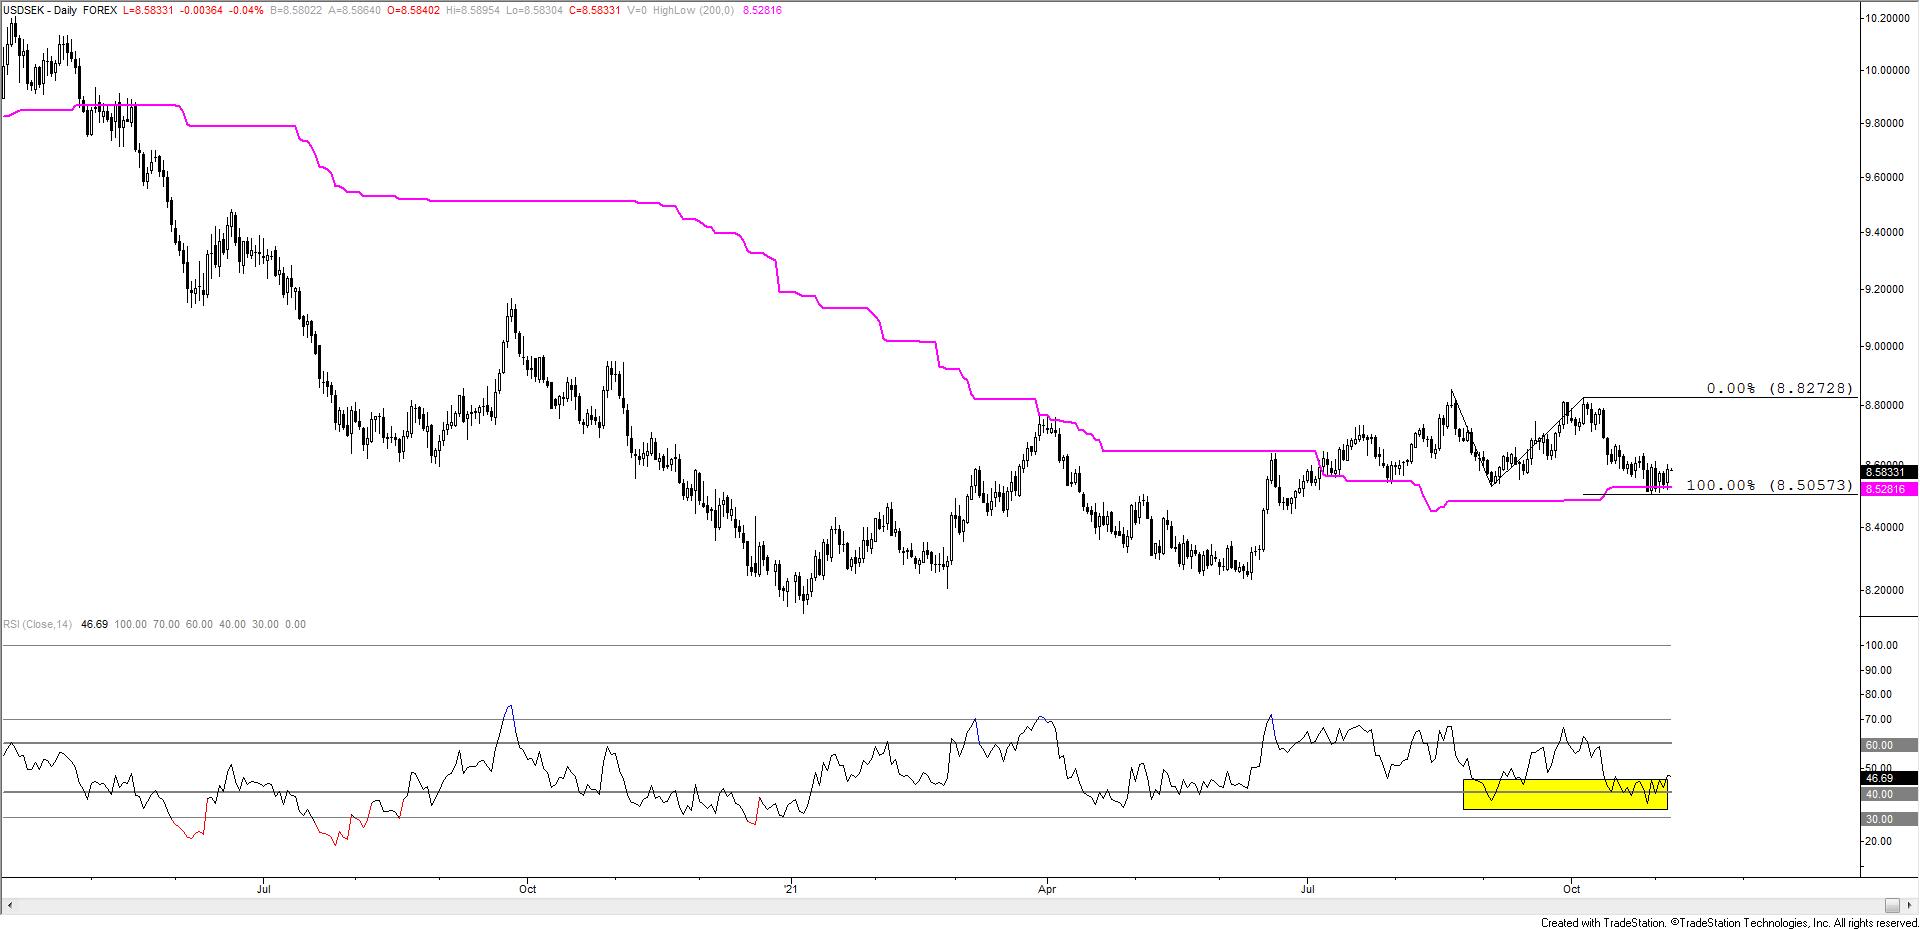
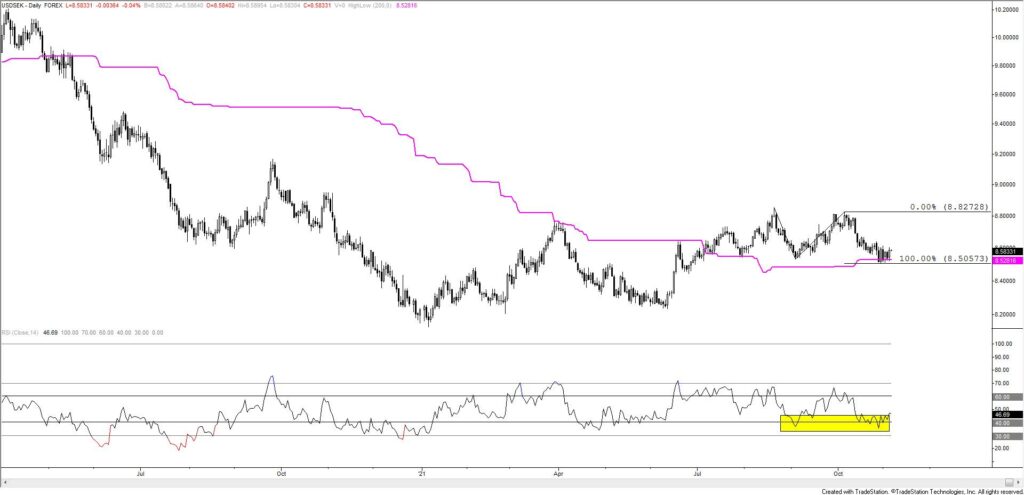
I have not been ‘in tune’ with USD moves for the better part of the last month. During periods of uncertainty, I find it helpful to go back to the basics. USDSEK is often a ‘tell’ for general USD trends and pivots. Here are several objective technical observations;
USDSEK is holding the 200 day midpoint (similar to the 200 day average)…this is bullish.
The decline from the 8/20 high is in 2 equal legs…this is characteristics of a corrective decline within a larger advance…bullish
Daily RSI registered ‘overbought’ readings at price highs over the last year and RSI readings at price lows have been above 30…this is also bullish.
In summary, the weight of evidence is USDSEK bullish and therefore generally USD bullish (notably against European FX). At least that’s where my mind is at the moment.
November 4, 2021

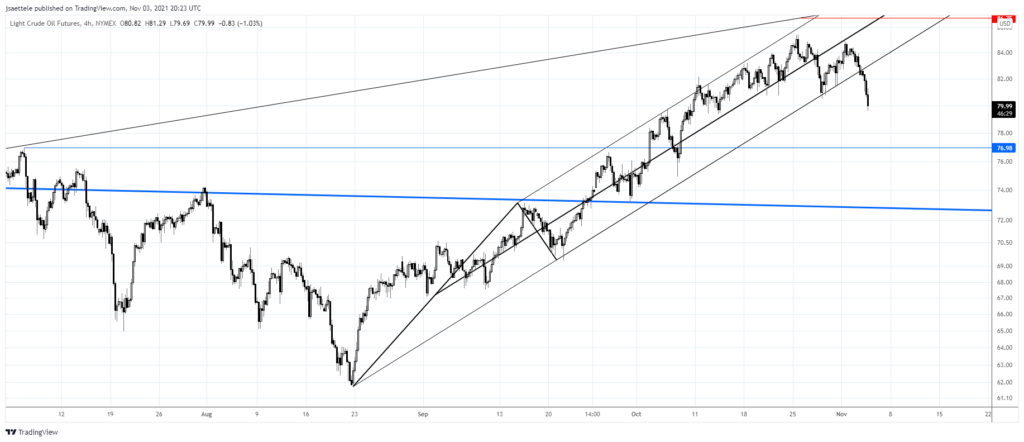
Crude traded up to 84 (a bit above) and has gone straight down since. 82.20 is now proposed resistance if crude bounces. Downside focus is the July high at 76.98 and possibly the top side of the LONG TERM former resistance line (now support) near 73. The weekly chart below shows the this long term chart in its entirety.
November 3, 2021
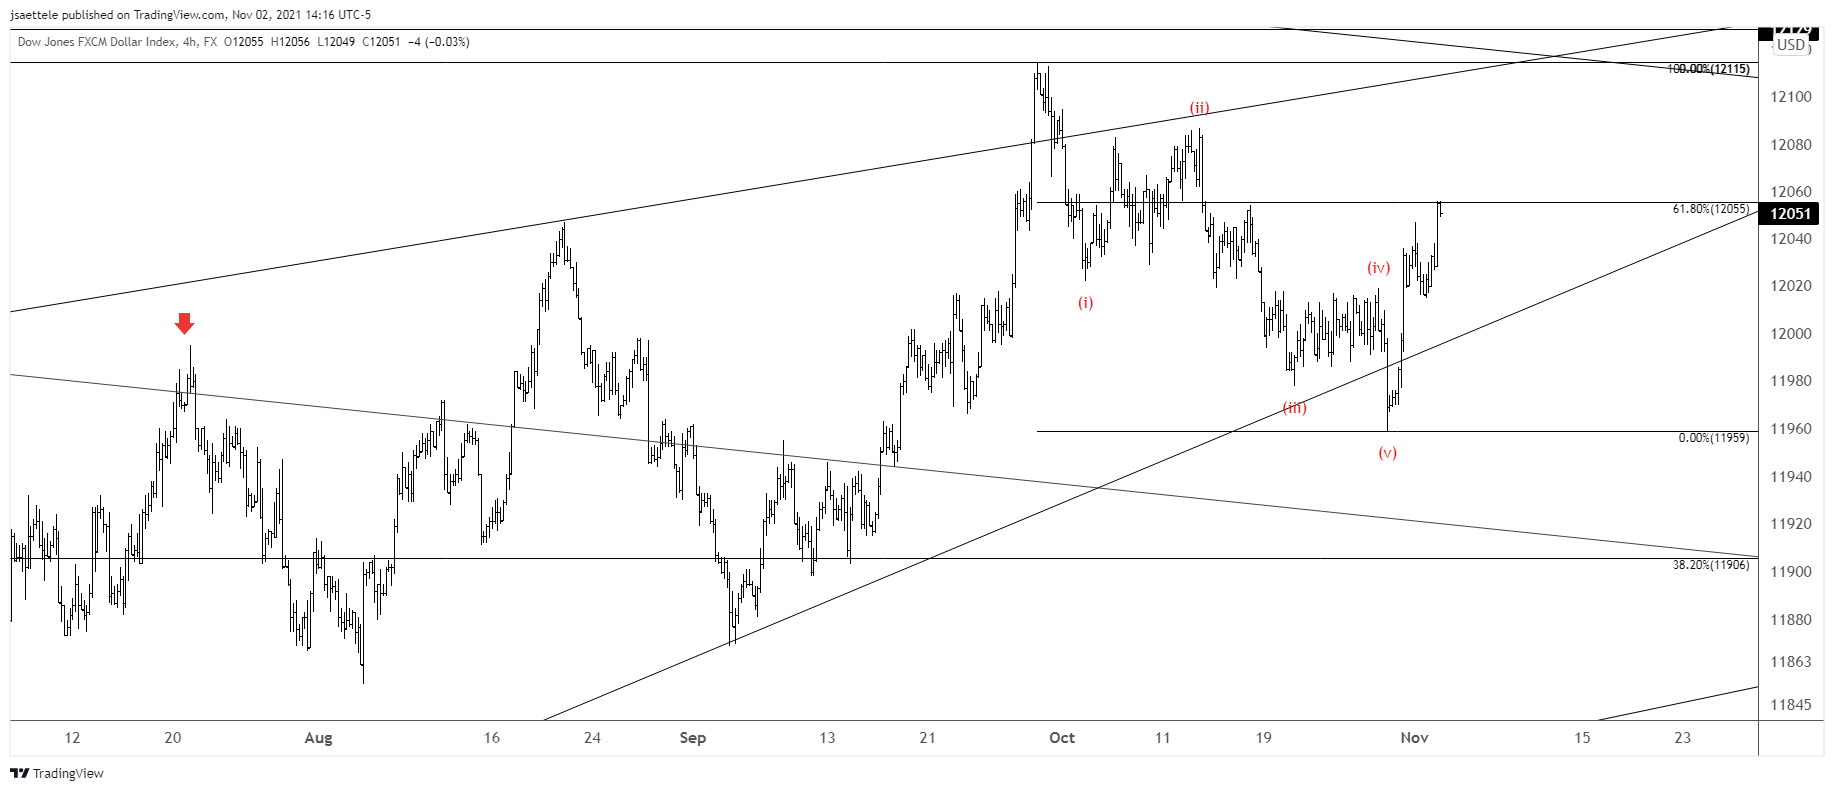
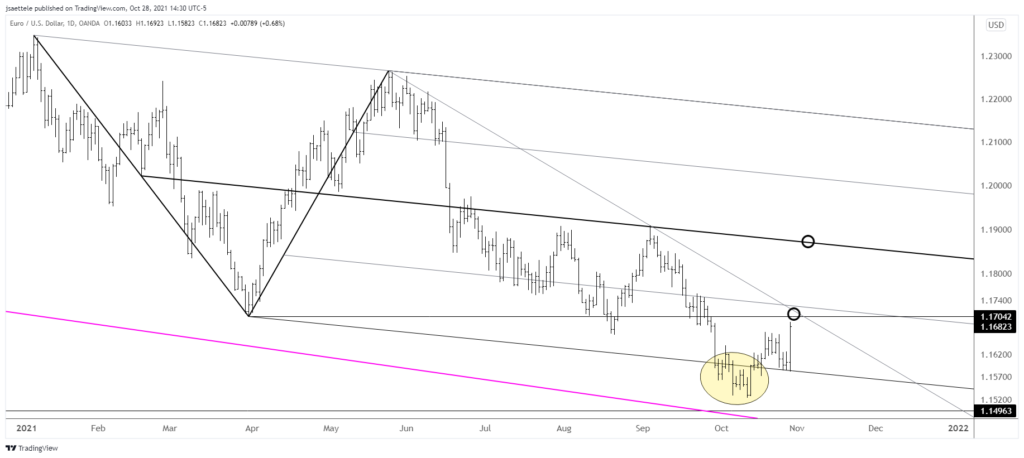
Clarity is lacking ahead of FOMC as it pertains to general USD direction. The ‘break’ lower in the USD last week proved false but one can make the case that action since September high is 5 waves down and 3 waves up. The rally has retraced 61.8% of the decline too so it’s possible that price resumes lower now. Confidence in direction is extremely low right now. Hopefully, this clears up post-FOMC.
November 2, 2021

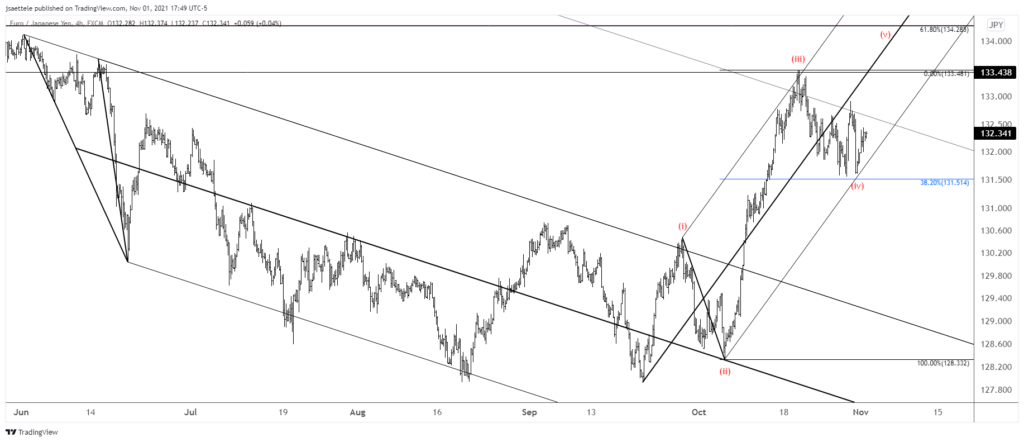
Action since the October high in EURJPY is probably a 4th wave. As such, expectations are for a 5th wave rally to a new high. A possible target is 134.29, which is the 61.8% retrace of the 2014-2016 decline and where the rally from the May 2020 low would consist of 2 equal legs. Watch for support near 132.00.
October 29, 2021
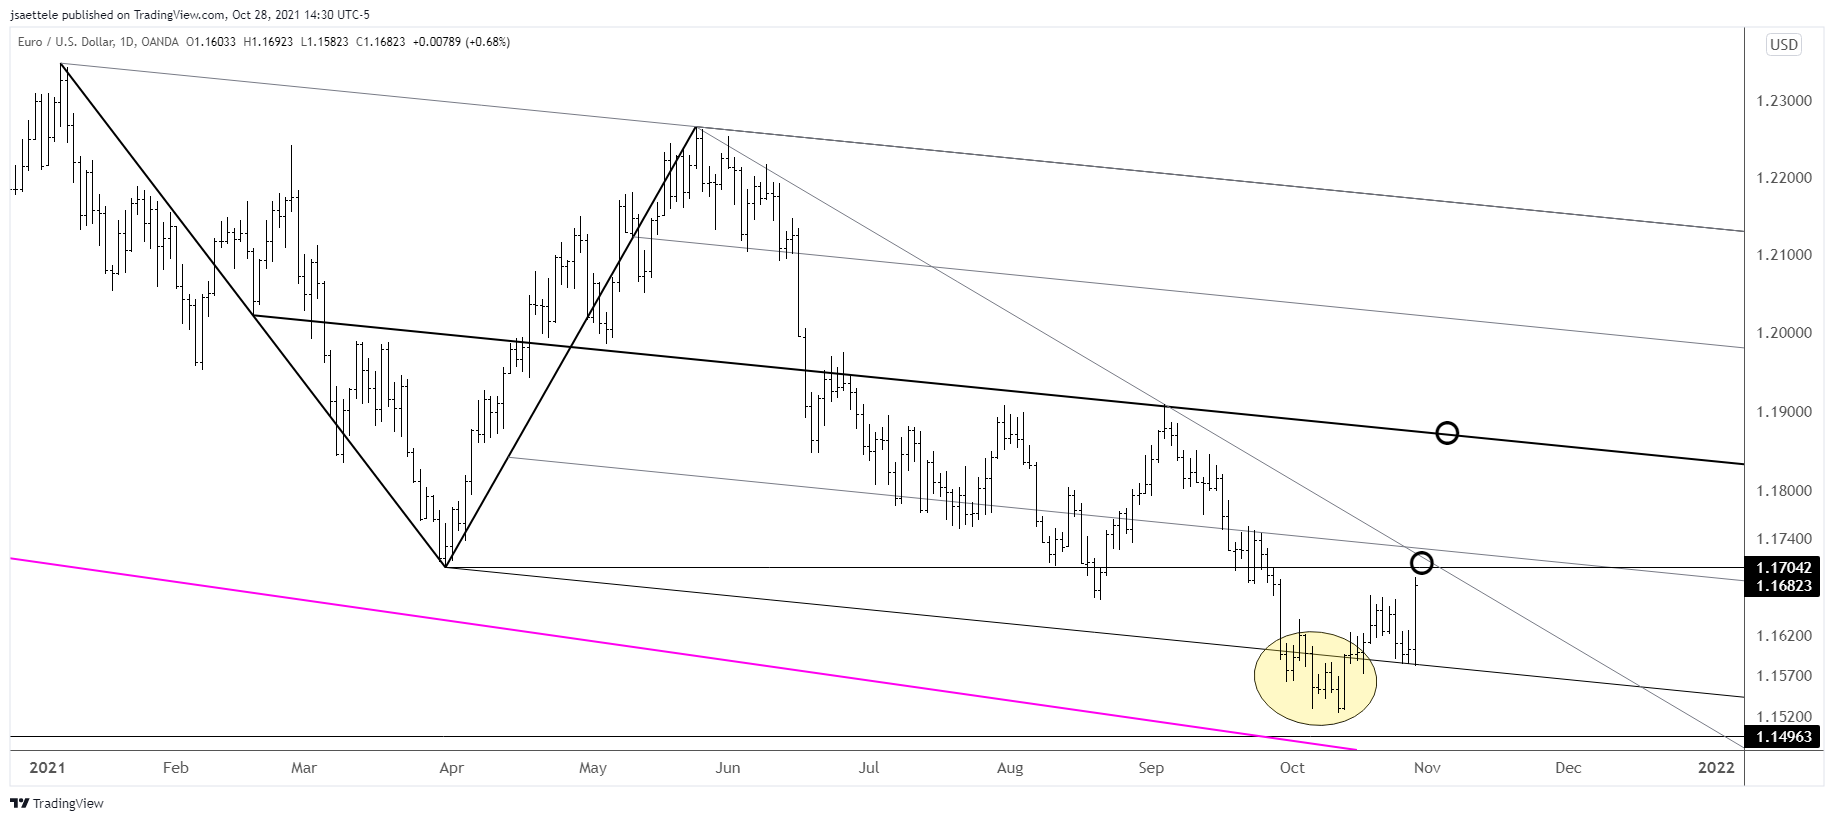
Remember the channel from the January high? EURUSD has confirmed a false break below the channel…which is bullish (low of the last 3 days is right at the channel line). Near term, I’m thinking 1.0700/30 puts up a fight. If it does, then watch for support near 1.0640. The next 3 charts show instances when EURUSD made a 5 day low and 20 day high on the same day. Today is just the 4th time that has happened since the euro’s inception. In the previous 3 instances, the ‘show of strength’ day (Wyckoff term) preceded large advances although not necessarily right away.
October 28, 2021

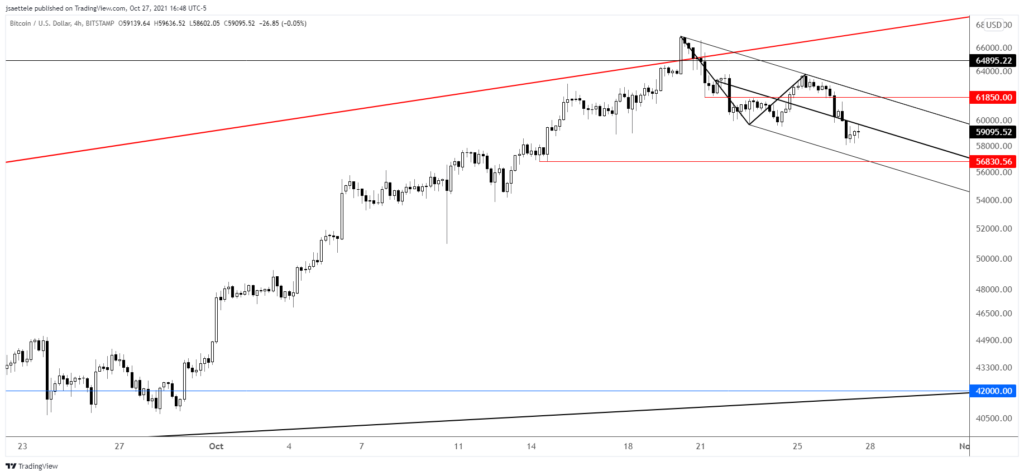
BTCUSD is off 13% since the top last week. If price drops under the short term lower channel line near 56830 then weakness will be considered impulsive and ‘waterfall’ weakness would be on the table. Watch for resistance near 61850. The weekly chart is shown below. This looks ‘toppy’ to me. Yes, ‘toppy’ is an official technical term. Former trendline support has provided resistance on the way up, a doji candle formed last week, and the rally failed after taking out the prior high. Seems bearish. Finally, is BTCUSD trying to tell equities something (see 2 charts down)
October 27, 2021

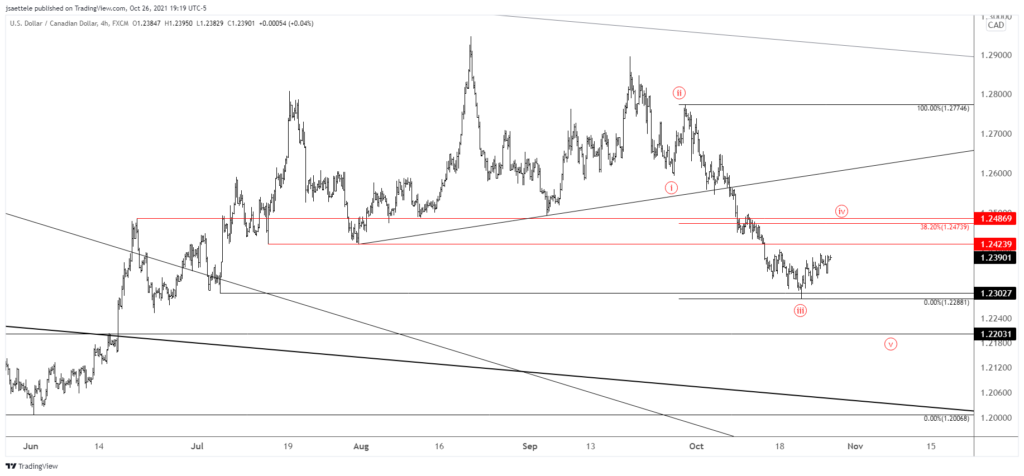
No change to USDCAD but I’m re-posting the chart because BoC is tomorrow. I continues to favor the scenario in which the bounce from 10/21 is a 4th wave. Ideal resistance is 1.2470/90 (38.2% retrace of well-defined pivot since June).
October 26, 2021

Gold broke above trendline resistance and the 200 day average today. The top side of the trendline (blue) is now proposed support near 1790. Upside focus is the line off of the August 2020 and June high. That’s about 1840.