Education
July 30, 2020
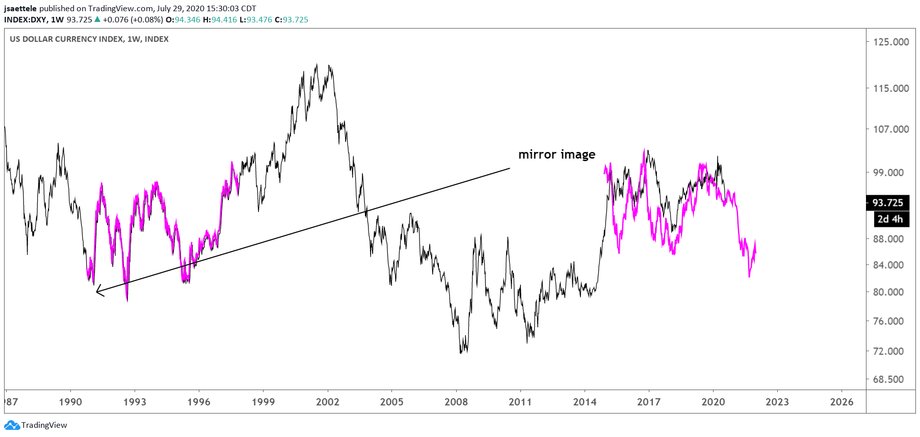
This is an analog that we’ve been following for several years. The mirror image of DXY price action from the February 1991 low closely matches price action from the March 2015 high. Figure out ‘why’ if you want but it continues to ‘work’ and I’m intrigued because the analog suggests consolidation through year end before the USD takes a digger in 2021. A close-up view is below.
July 15, 2020
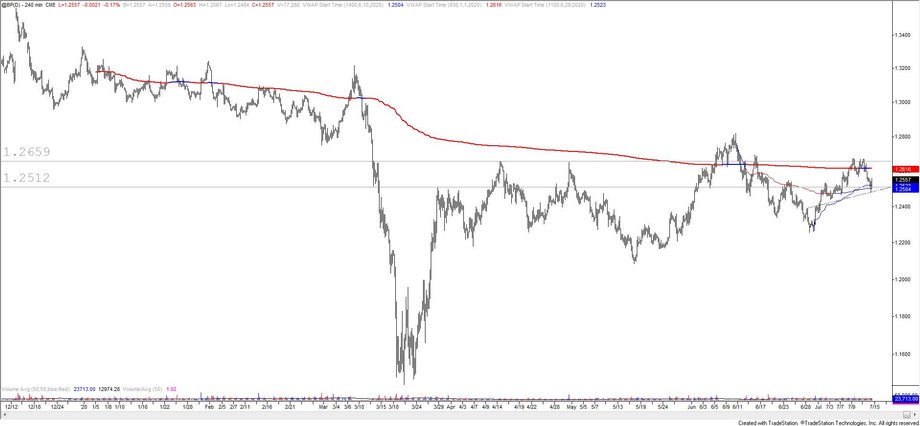
British Pound futures pulled back to VWAPs off of the June high and low. The level is also the 200 period average on the 4 hour chart (spot is below) and more or less the breakout level from the short term head and shoulders bottom. I like GBPUSD higher as long as price is above today’s low. Near term support and resistance levels are 1.2510 and 1.2618.
July 9, 2020

Scand.Ex is pleased to present the next video with trading analysis by Jamie Saettele, our Chief Technical Analyst.
July 9, 2020
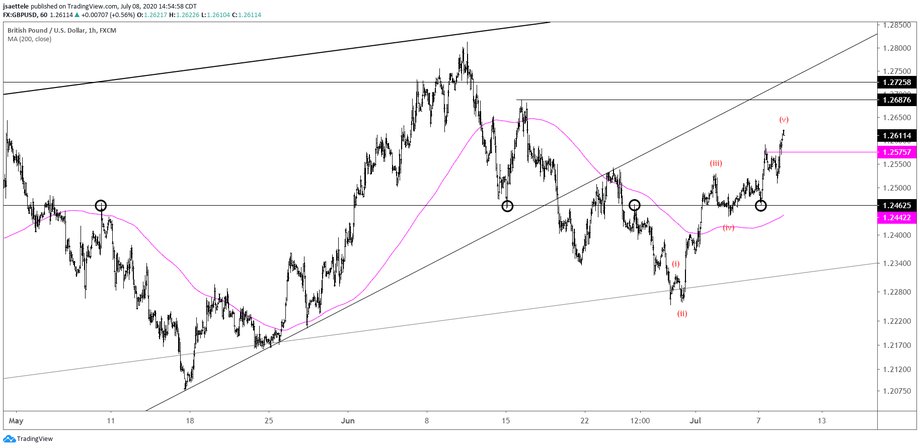
I remain broadly constructive GBPUSD but price could pull back from the current level, which is defined by 2020 VWAP (see 2 charts down). I’m showing 2 technical interpretations. An Elliott interpretation is that 5 waves up are complete or nearly so and that price should pull back towards the area of the prior 4th wave.
July 7, 2020
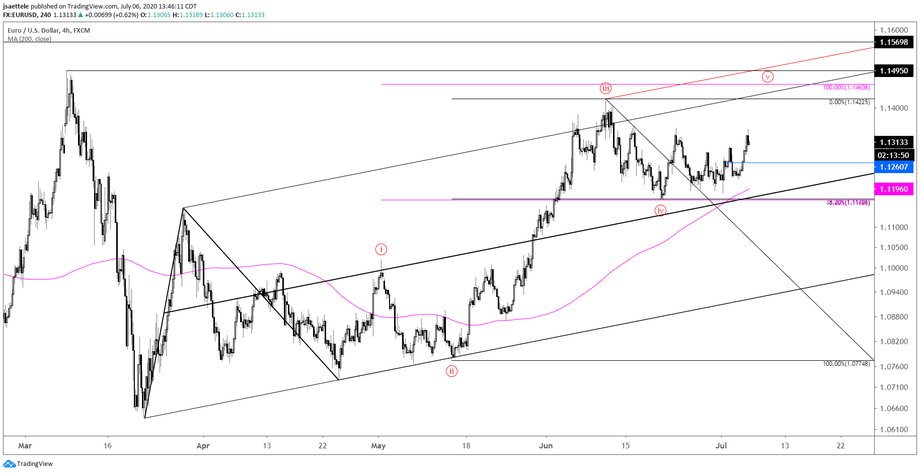
The EURUSD drop from 6/10 to 6/19 retraced exactly 38.2% of the rally from 5/7. 4th waves often retrace 38.2% of 3rd waves. The implication is that EURUSD is headed higher in a 5th wave. A possible target is where wave 5 would equal wave 1 at 1.1460. The high volume level at 1.1261 is a good spot for support (the year open is 1.1260 by the way). Be aware of the current ownership profile however (see below). Speculators are the most long since the 2017 high.
July 2, 2020

USDJPY completed its flat and reversed from the well-defined 108.00/08, carving a bearish outside day today. 108.00 is the 61.8% retrace of the February-March decline. 108.08 was high print a number of days in April and May. The fractal nature of markets is on display in the chart below. The pattern from 6/5 to today is the same shape as the pattern from 3/24 to 6/5. That’s a fractal! Finally, I like that Yen futures held 2020 VWAP and VWAP from the February low. Very short term focus is on 106.92 although significant downside potential exists in USDJPY as long as price is under today’s high.
July 1, 2020

Scand.Ex is pleased to present the next video with trading analysis by Jamie Saettele, our Chief Technical Analyst.
July 1, 2020
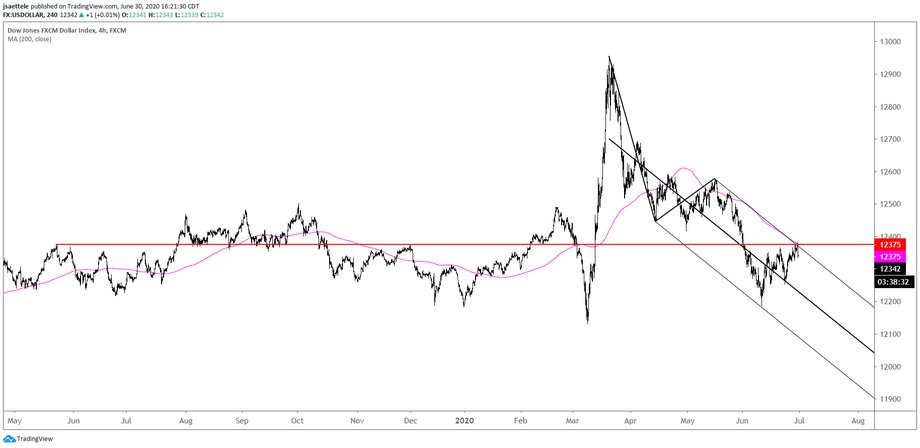
USDOLLAR traded 12383 today, not quite reaching the proposed resistance zone. However, that may be the end of the counter trend bounce. Price reversed right at the upper parallel from a Schiff fork, the 200 period average on the 4 hour chart, and at a level that has been support and resistance since May 2019 (red line). As long as today’s high is in place, risk is lower in my opinion.
June 24, 2020

Scand.Ex is pleased to present the next video with trading analysis by Jamie Saettele, our Chief Technical Analyst.