Education
January 6, 2022

ETHUSD has broken the line described yesterday (magenta line). This line is resistance if reached near 3640. Price is testing the 200 day average now (not shown) but the more important level is probably VWAP from the May 2021 high at 3050 (see below). Bigger picture, my view is that price drops to 985 or so in a 4th wave.
January 5, 2022

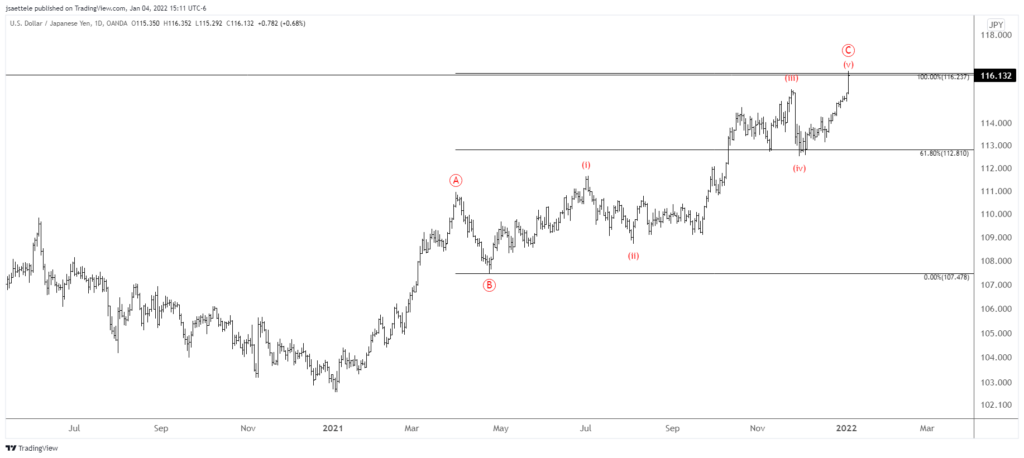
Well, the re-test is out of the question but this USDJPY move could be a false breakout. The chart above shows square root levels. Square the year opening price and add/subtract that number in increments. For USDJPY, the square root of 11510 is 107 so the first square root up is 116.17. The idea is to look for a turn at the first square root level during the first week of the year in a market that is already extended. Several examples are below. An Elliott case is also made for a top as the rally from January 2021 consists of 2 equal legs (log scale). This chart is below. An objective trigger isn’t present yet.
December 30, 2021
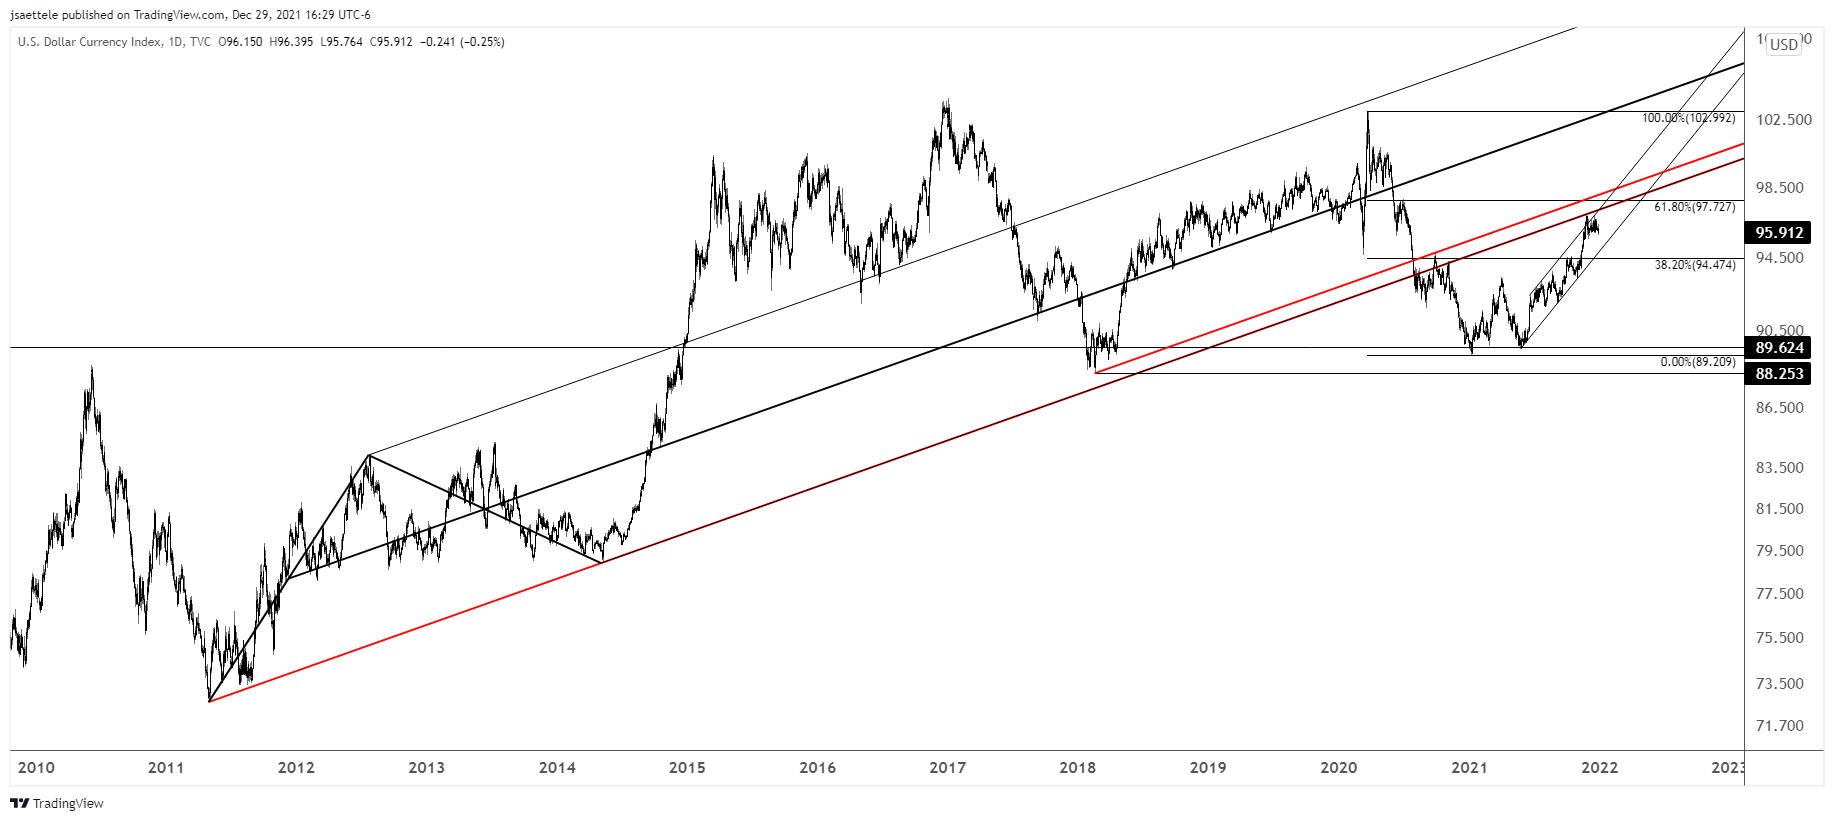
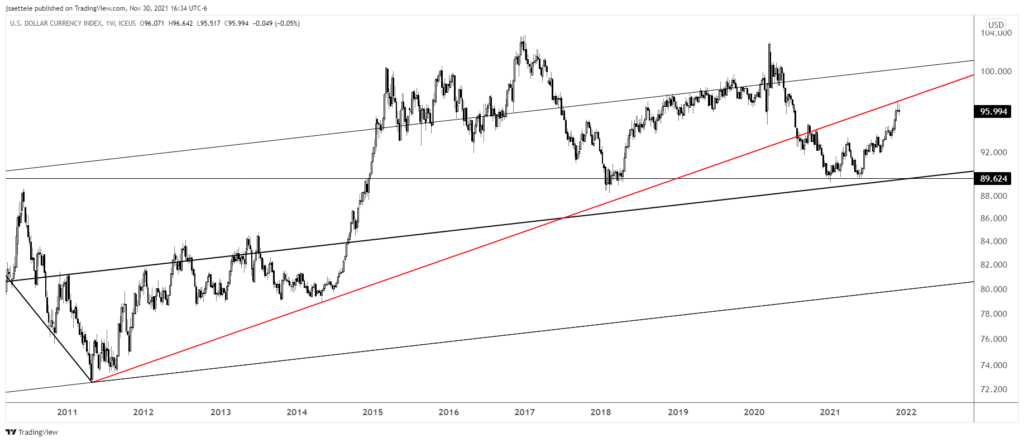
This is the last update of 2021. A new calendar year is significant and those details will be addressed next week. The charts in this post highlight why I’m heading into 2022 with a USD bearish mindset. The chart above is a starting point insofar as making a USD bearish argument although the big picture ‘textbook’ trigger doesn’t occur until a break of the channel near 95. Until then, respect potential for strength into the 61.8% retrace of the decline from March 2020 at 97.73.
December 28, 2021

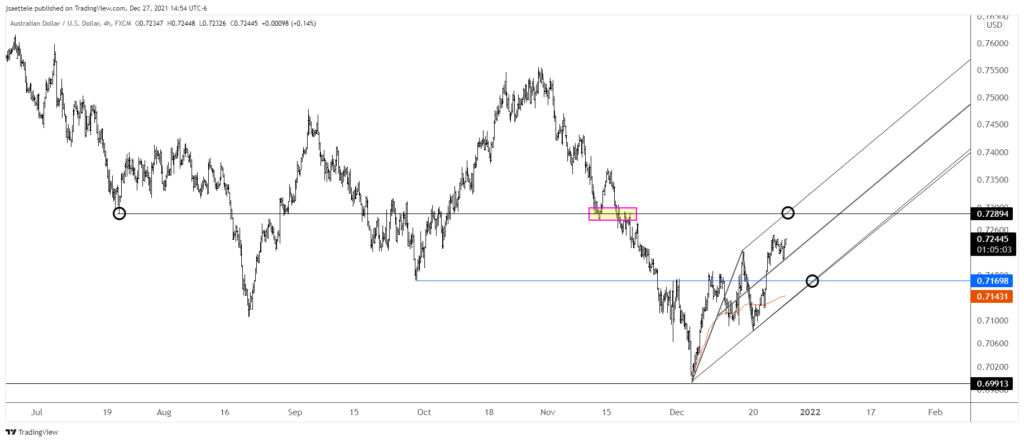
AUDUSD continues to make progress within what I believe is a new bullish sequence. As such, focus is on identifying support to buy. .7170 sticks out as the ideal level. This has been an important horizontal level since the September low. The price intersects short term channel support at the end of this week (and year). Maybe we get a big buying opportunity right at the beginning of 2022! .7290 or so is still proposed resistance for a pullback.
December 23, 2021

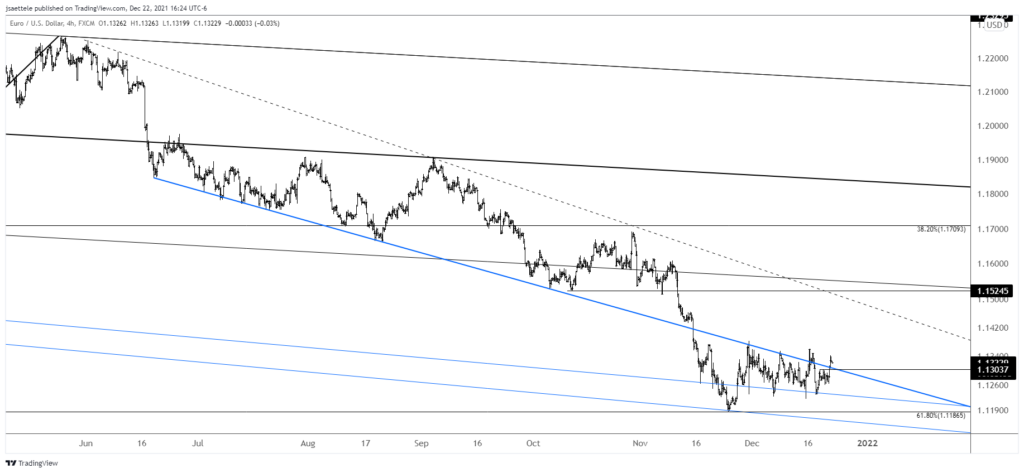
EURUSD is once again flirting with an important breakout above the trigger line. Price is more or less right at the line now. Again, a break above is needed in order to indicate an important behavior change. Ideally, price rises a bit more before pulling back to the line near 1.1300 and holding it as support. That’s the setup at least! Near term upside remains about 1.1520.
December 16, 2021

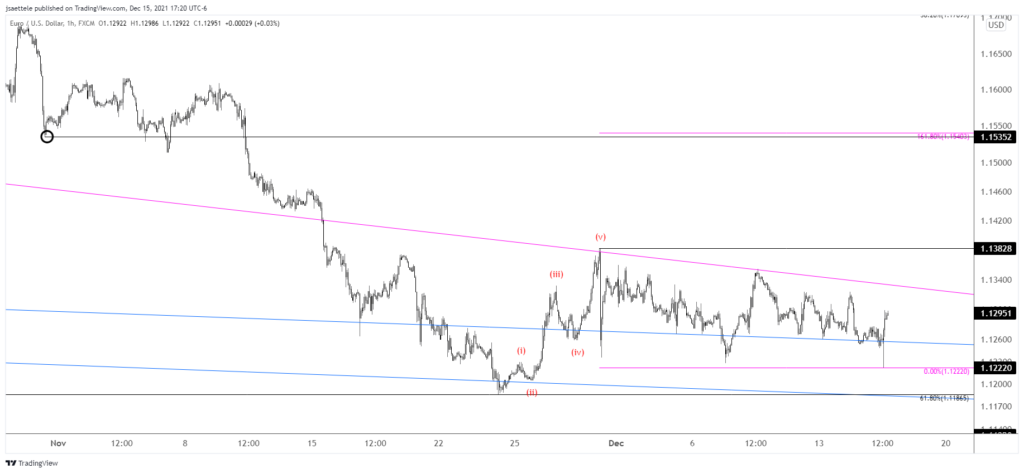
Is the nightmare correction over for EURUSD? The ‘look’ is definitely there. For Elliott nerds, everything from the 11/30 high constitutes a complex correction labeled W-X-Y. This means that the drop is in 3 waves but the corrective legs of the structure are also corrective in nature. Upside focus is the 161.8% retrace at 1.1540, which is also the 10/29 low. Proposed support is the high volume level from today at 1.1273 and 61.8% of today’s range at 1.1252. ECB is tomorrow.
December 15, 2021

The USD remains stubbornly up to flat. The psychological situation reminds me of early in the year when the USD was stubbornly lower for longer despite multiple reversal signals. Of course, price eventually resolved higher and now I want to go the other way! The underside of the former trendline support was reached 3 weeks ago and nothing has happened since. The situation should resolve in the next few days with Fed, ECB, BoE, and BoJ scheduled. We’re at resistance therefore I’m ‘thinking’ lower. The chart of daily closes below is a thing of beauty with respect to confluence resistance.
December 9, 2021
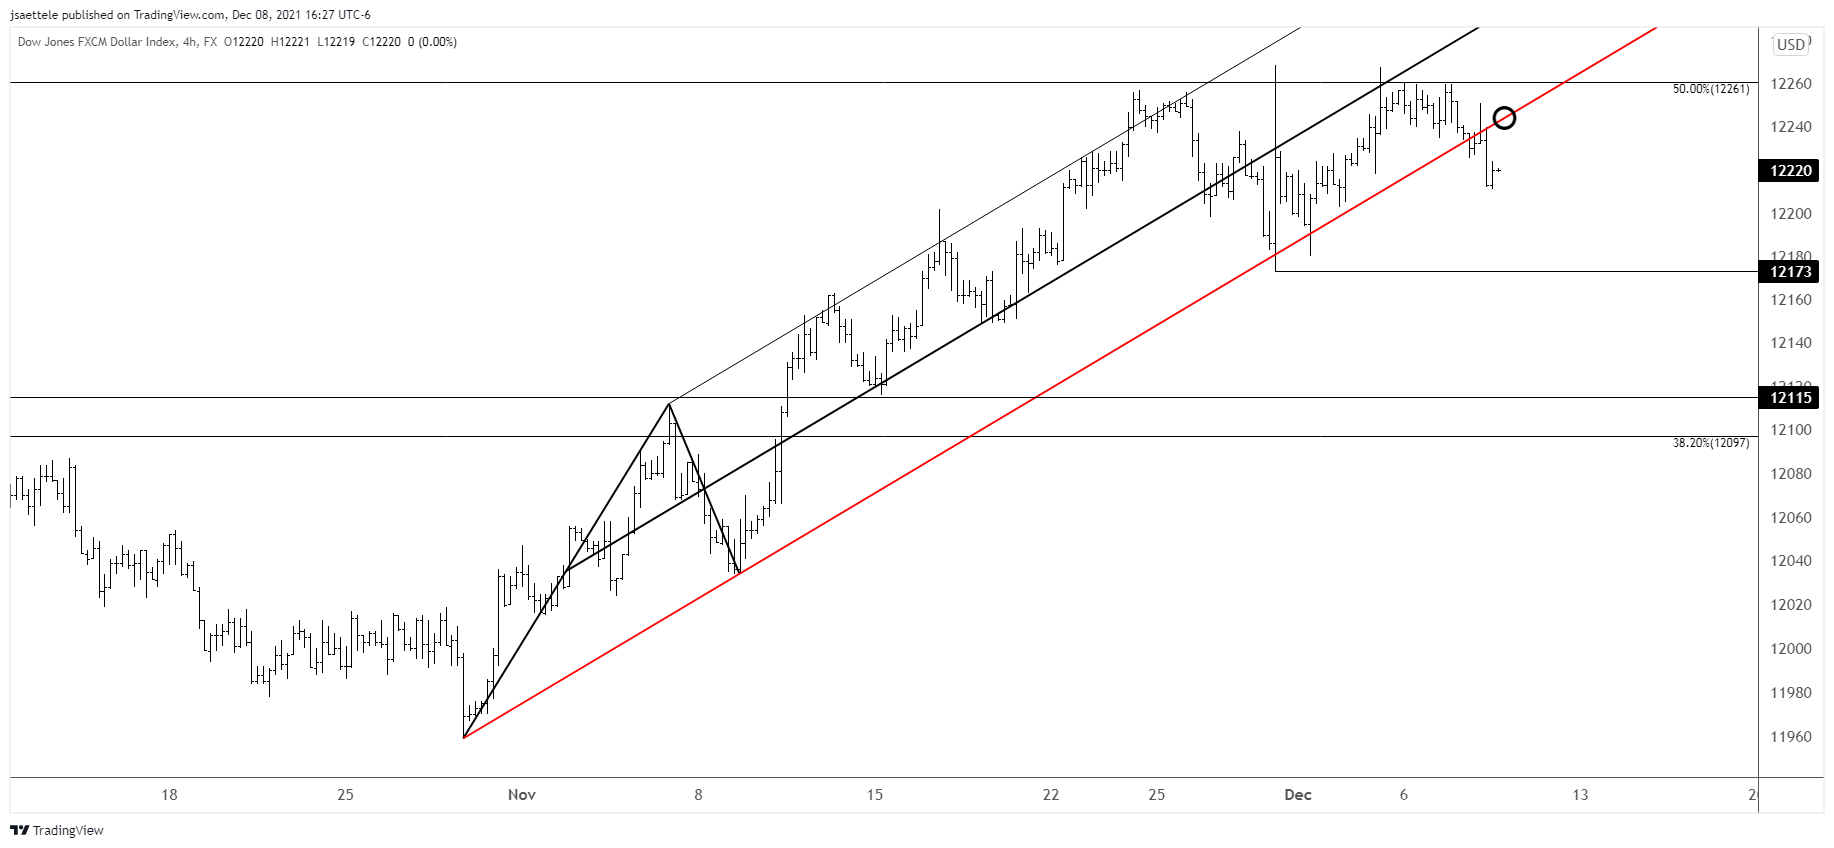
USDOLLAR broke the channel! The development suggests that the broader trend is lower. If ‘lower is legitimate’ then the underside of former channel support should provide resistance near 12245. We’ll worry about downside levels of interest as the situation evolves.
December 1, 2021

The DXY high is right on the trendline that was pointed out last week (see chart below for the full picture)…we may have just seen a major top. Trading wise, I’m looking towards 93.30/50 with 95.20s as a possible bounce level. The lower zone is channel support. That will be the big test. If DXY is a bear then 96.20s should provide resistance.