Education
November 1, 2020
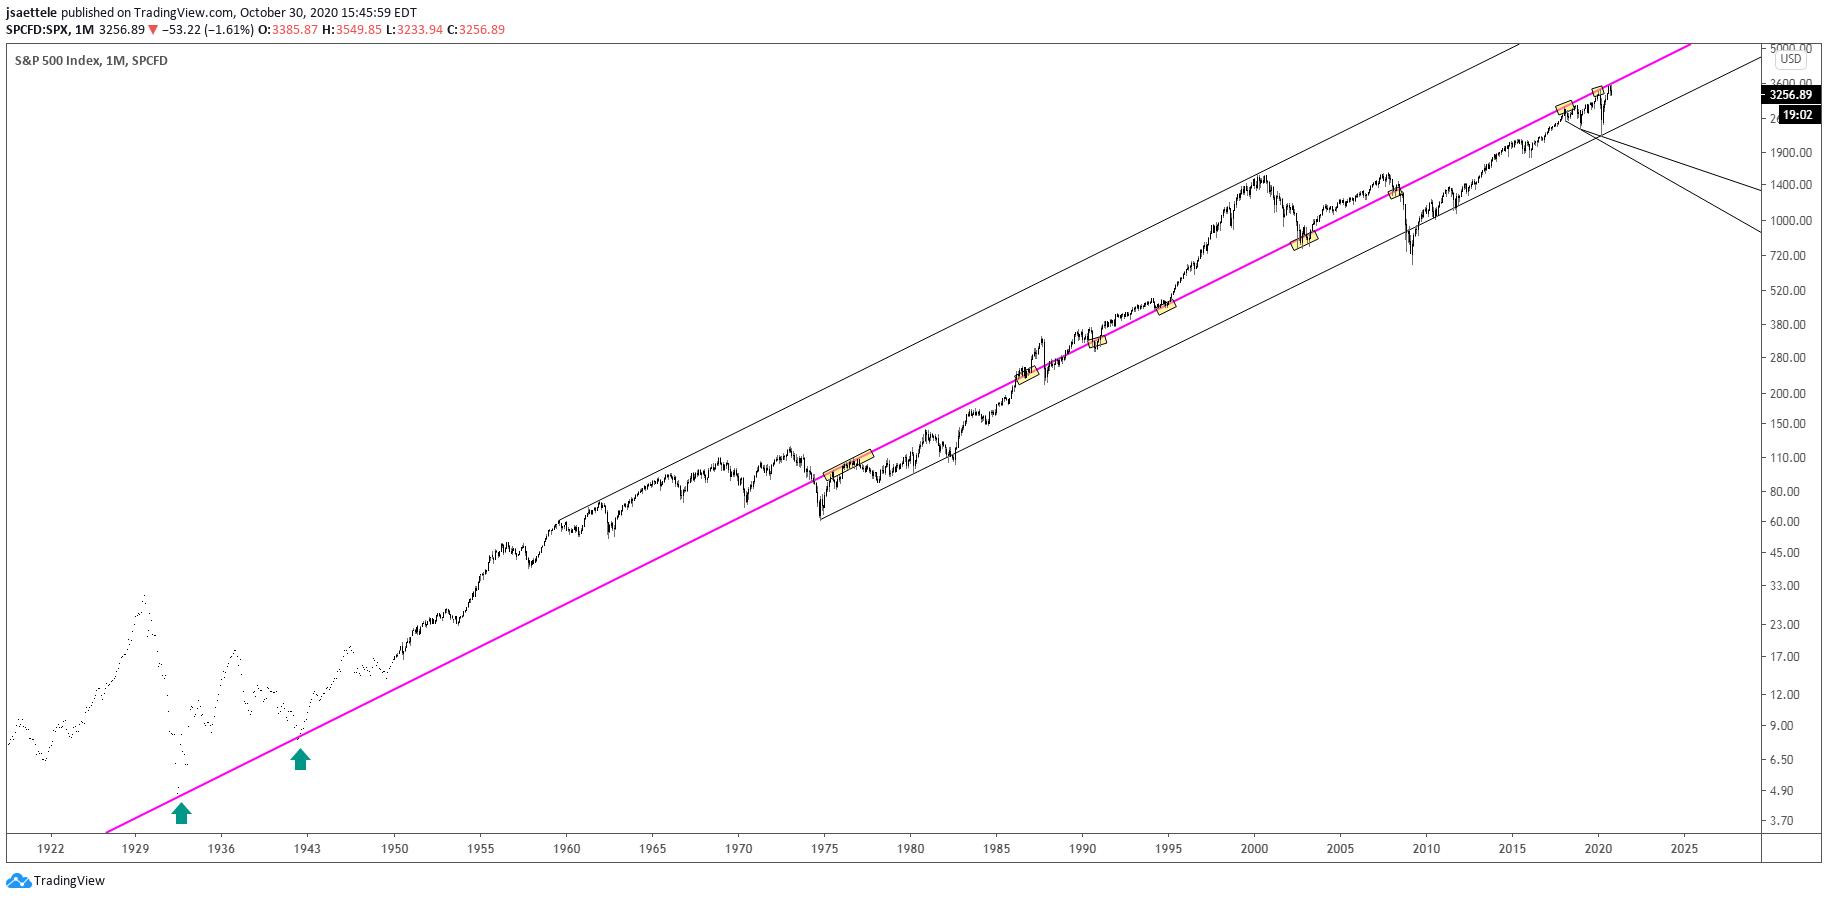
Another month is in the books and SPX continues to trade ‘heavily’ under the its ‘meridian line’. An inside month formed in October. Recall that September was an outside bearish month (see the close up view below). Of note is XHB (homebuilders), which made a monthly volume reversal in October (see below). Is this one of the last segments of the market to put in a top?
October 29, 2020

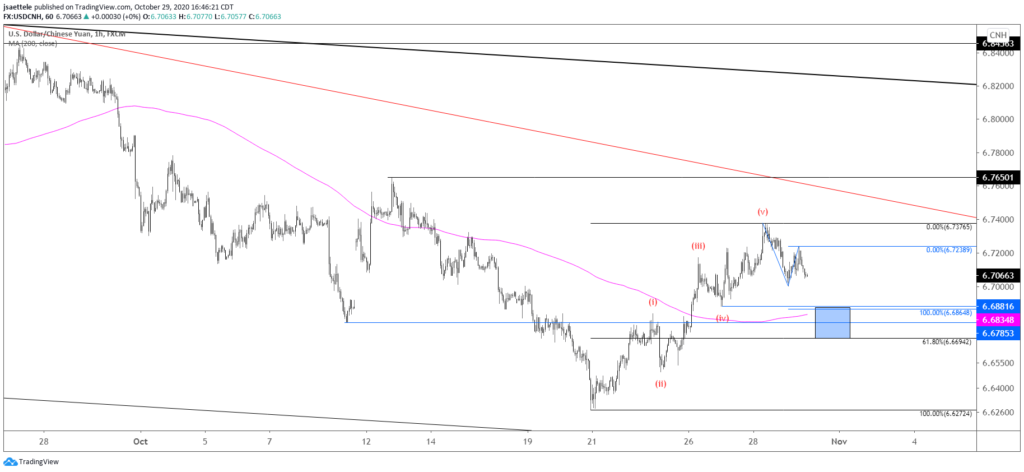
The USDCNH, DXY non-confirmation nailed the turn again. Upside is favored for the USD over the next few weeks but there are reasons to suspect that the USD pulls back slightly (so maybe a bounce in equities too). USDCNH pattern is one of those reasons. The rally from the low is in 5 waves so expectations are for a 3 wave pullback. That pullback is underway. The proposed support zone is 6.6690-6.6880.
October 28, 2020

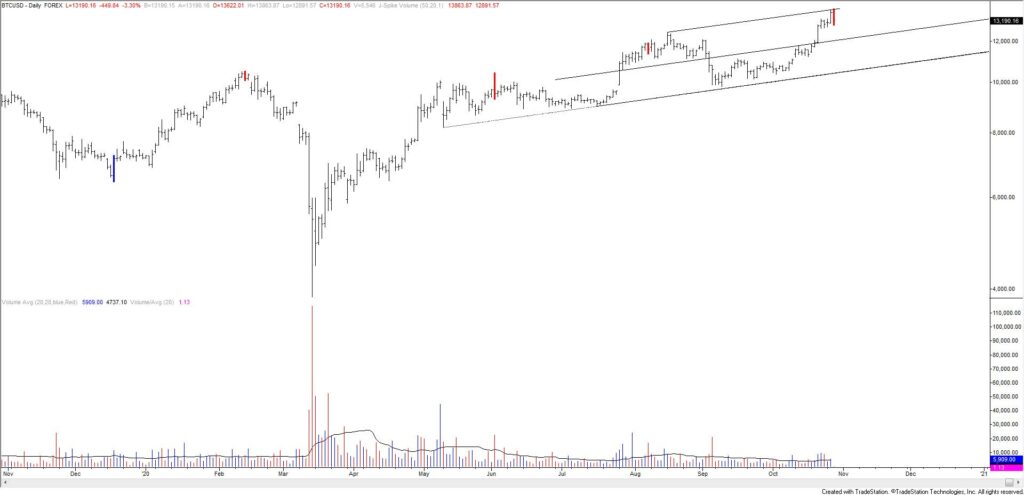
Bitcoin made a volume reversal today. The high was right at the top of a channel too. The longer term chart is extremely bullish but price could drop to back to 10,000 or just below and still be bullish on a longer term basis. Near term, the BTCUSD reversal lower doesn’t bode well for ‘risk assets’ in general. No, BTCUSD is not a ‘safe haven’. It’s been moving with everything else all year. The ONLY safe haven in the current environment is the USD (maybe Yen and US treasuries too).
October 27, 2020
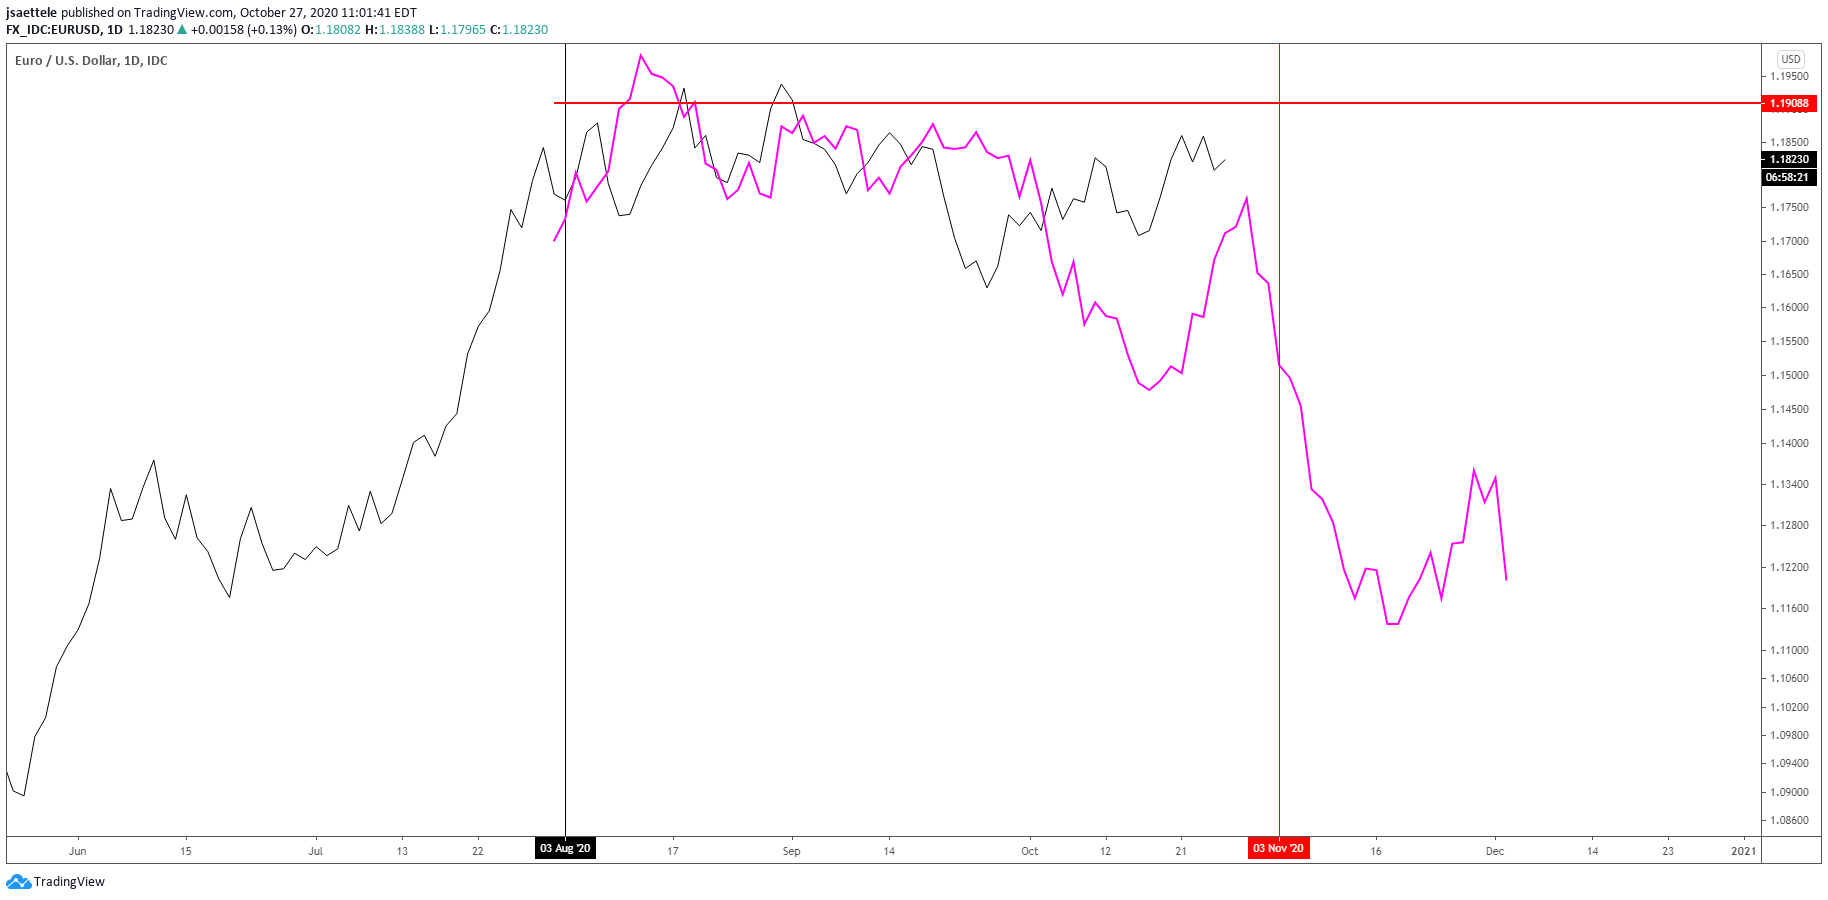
In case you haven’t heard, there are elections (president, congress, senate) in the U.S. next Tuesday, November 3rd. Do markets, notably the U.S. Dollar, tend to trade a certain way before and after U.S. presidential elections? In an attempt to answer this question, I plotted DXY in the 3 months leading up to and one month after every election since 1972 (blue for a Democratic win and Red for a Republican win). Each time series is compared to current DXY (in black). The vertical black line indicates election day. You’ll find these charts at the end of this report.
October 26, 2020
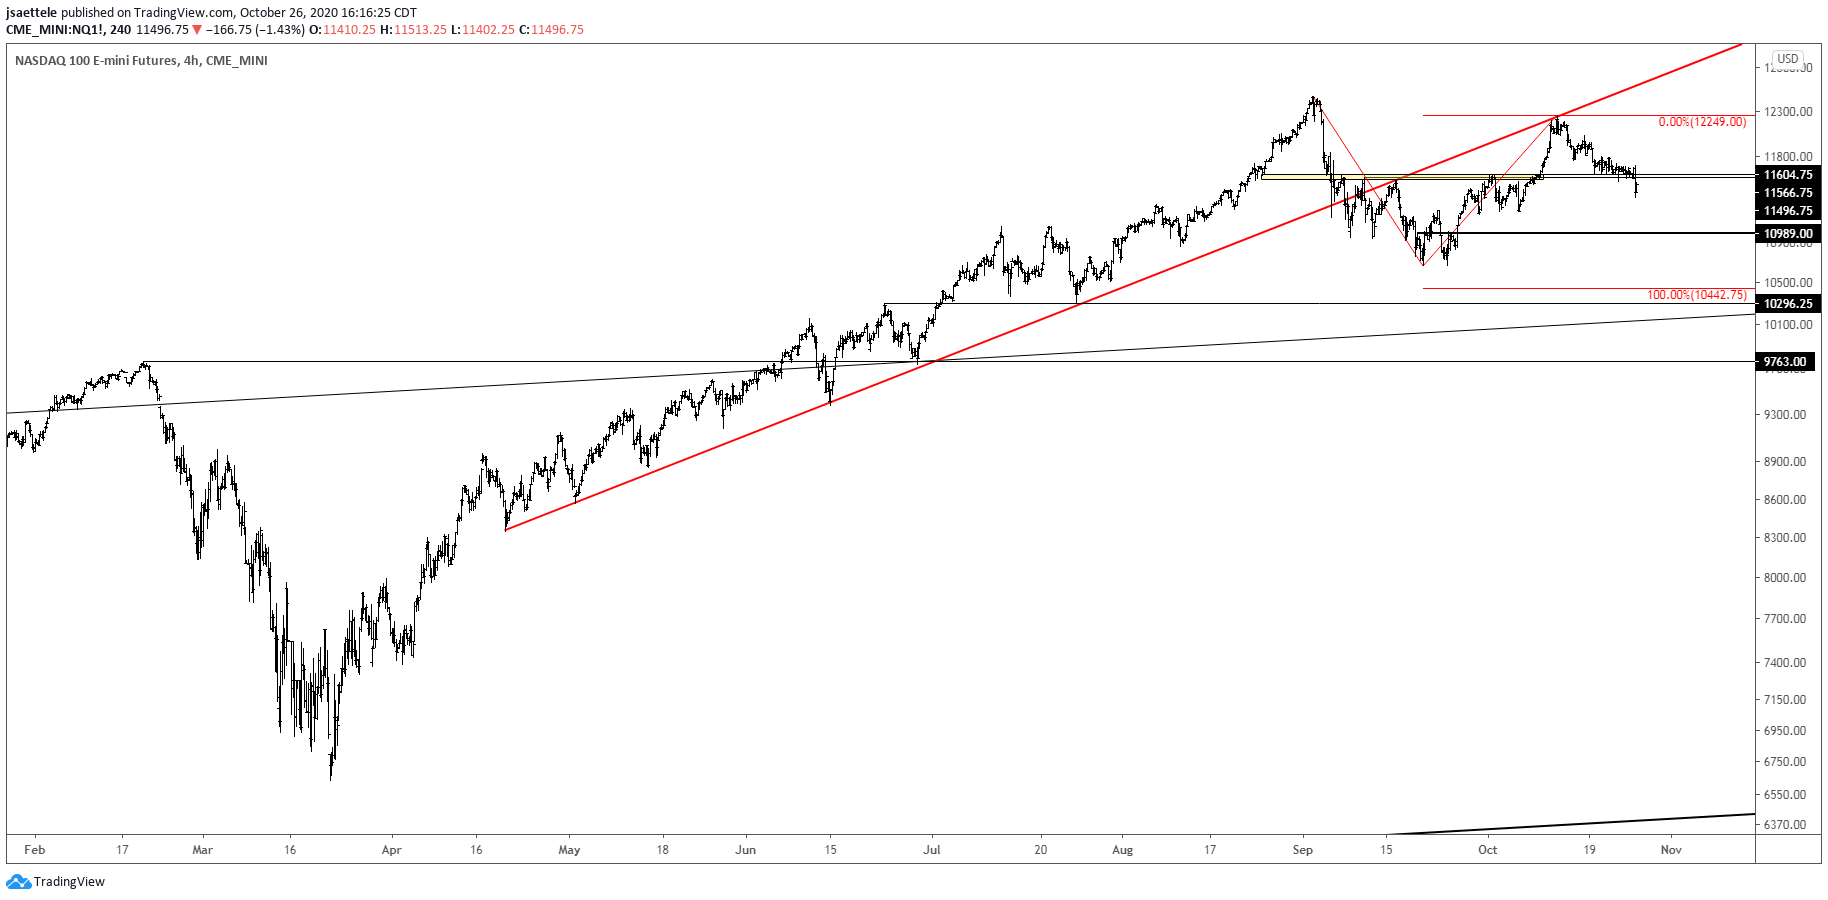
I’m treating the area around 11600 as near term bull/bear dividing line for Nasdaq futures. As long as price is below this level, I am looking lower. 10989 is a level to be aware of within the range with broader focus on 10300-10442. This is the 7/24 low and 2 equal legs down from the September high.
October 23, 2020

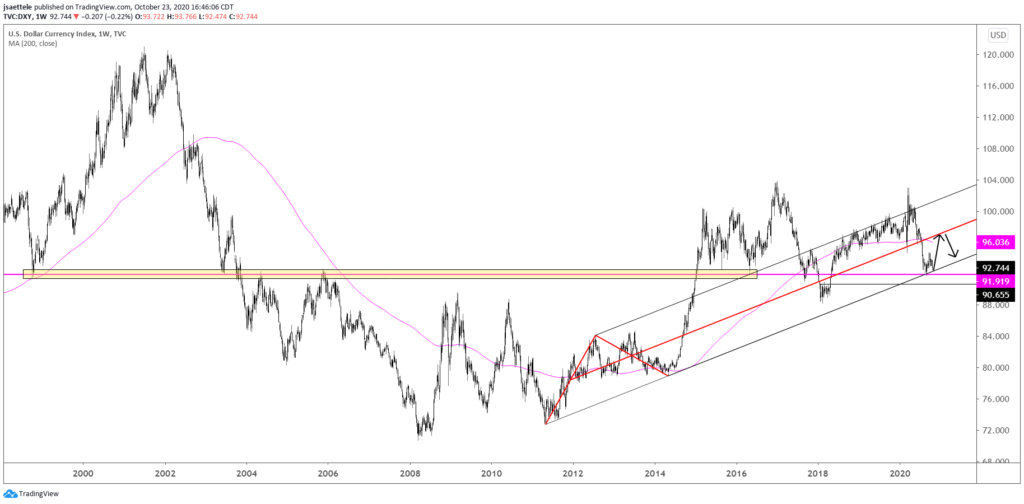
2011-2014 trendline support in DXY held in September. Focus is higher as long as price is above that level. 96-97 is a general zone to look towards. This zone includes the 200 week average and center line of the channel from the 2011 low.
October 22, 2020

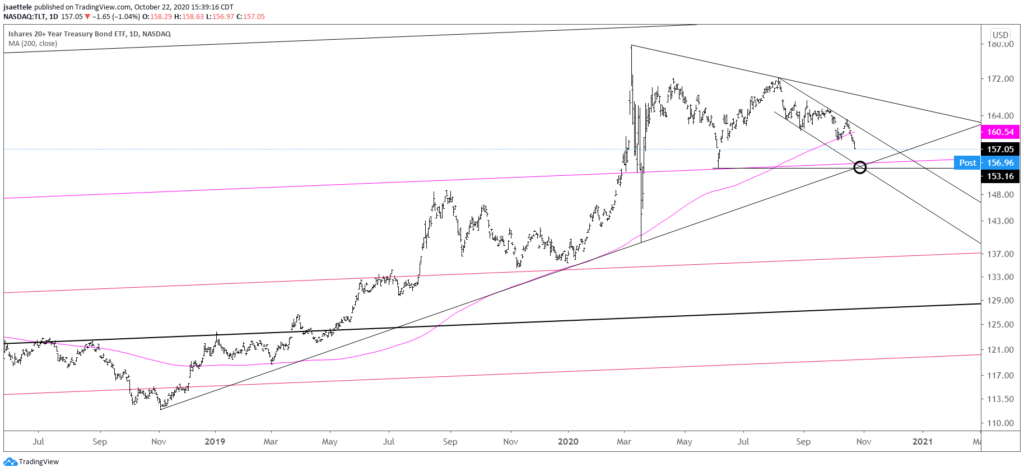
Bonds have been the big mover leading up to the U.S. election. TLT is under the 200 day average for the first time since December 2018. The next critical level to pay attention to is 153-154. This is the bottom of a short term channel, the June low, and the long term upper parallel from the channel that originates at the 2007 low (magenta line). The upper parallel nailed tops in 2012, 2015, and 2016 and the low in June. A long term chart is below. Expect the level to act as support BUT a break below would indicate a major behavior change in TLT (and bonds generally).
October 20, 2020
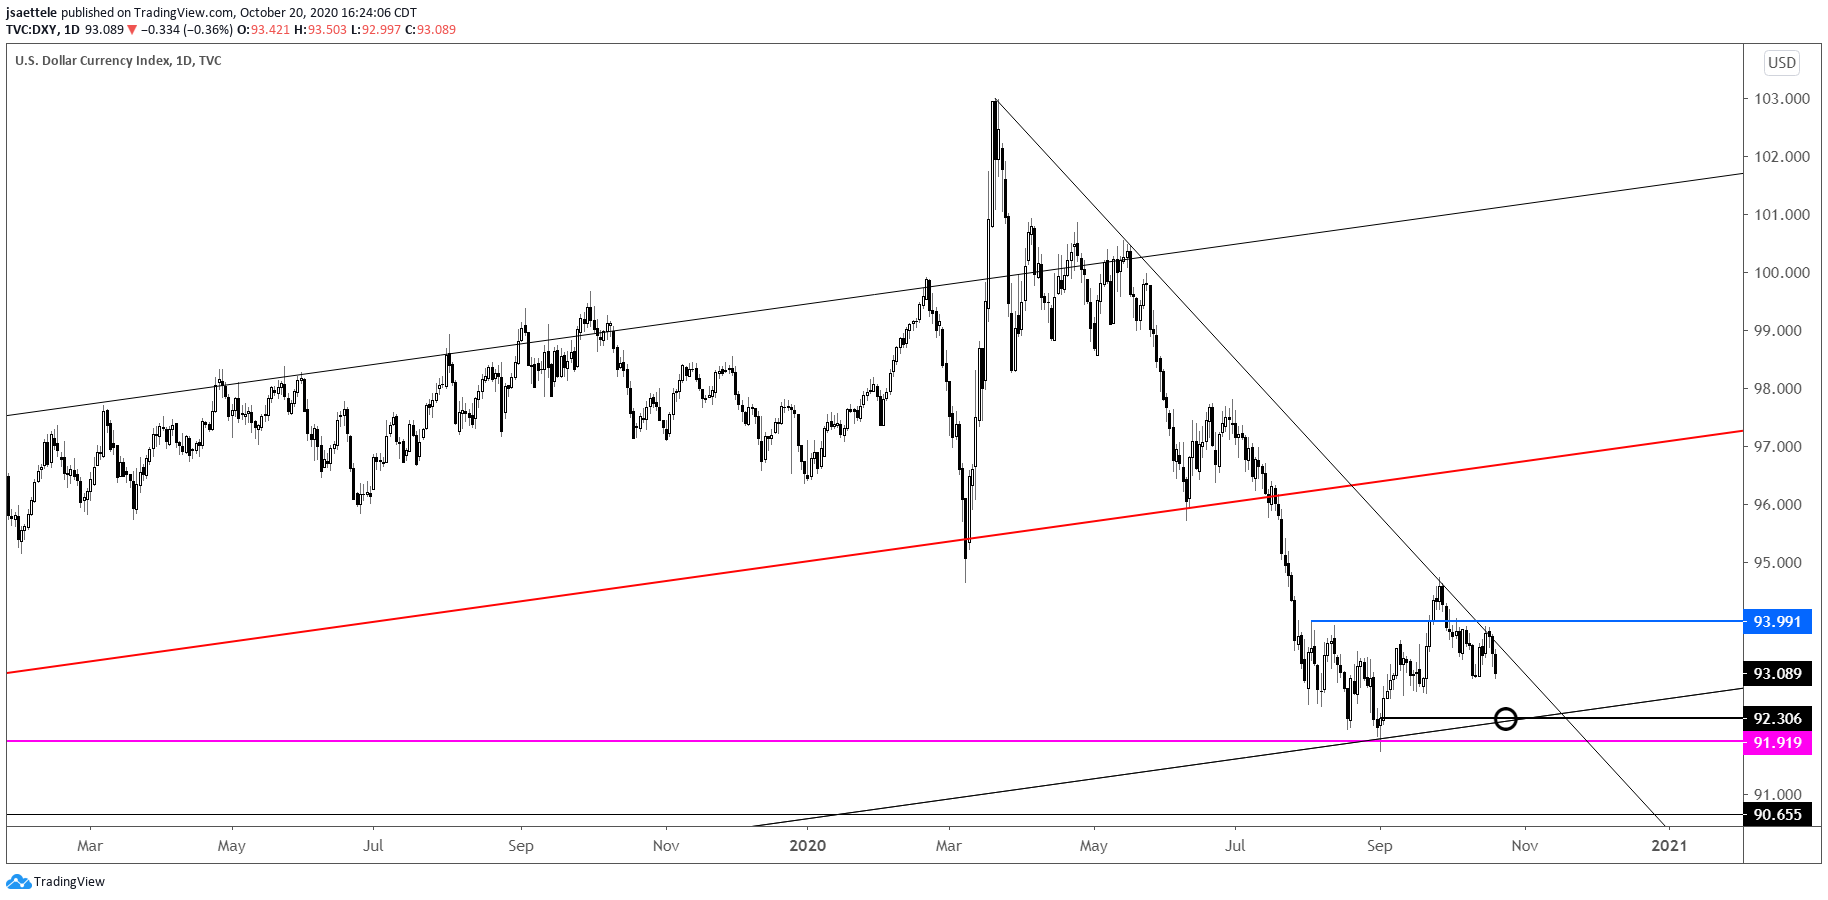
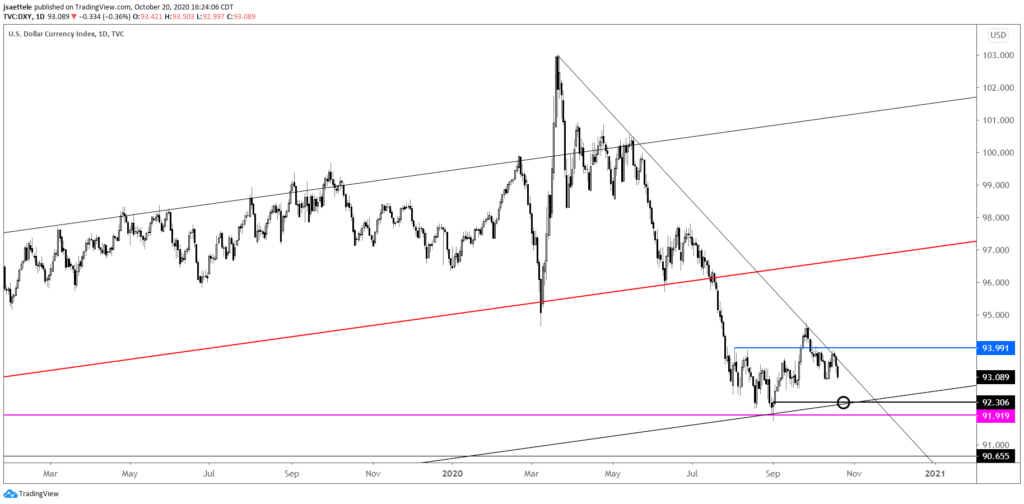
DXY continues to fail at channel resistance and ABOVE 94 is still needed to signal that trend has shifted from sideways to up. Until/unless that happens, be aware of another test of the long term support line near 92.30 (daily reversal support). 2 equal legs down from the 9/25 high would be 92.18. A longer term chart is shown below in order to remind that important support is under the market.
October 16, 2020

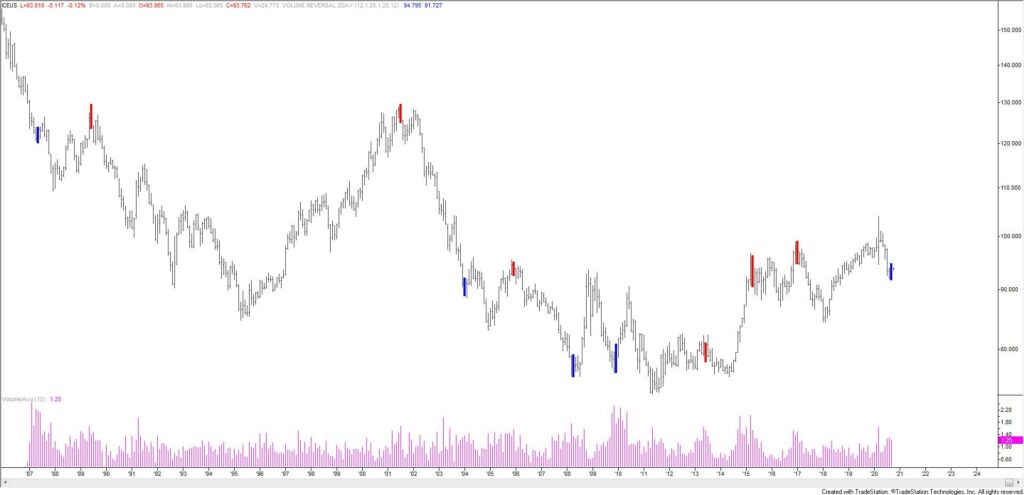
DX futures made a 2 bar monthly volume reversal in September. This means that August was a high volume up month and at least a 12 month closing high and September was a high volume down month. This is the first bullish signal since December 2010. UUP ( Dollar ETF) also made a monthly volume reversal. Price history begins in 2007 but this is the 4th bullish reversal since then. The prior 3 nailed major turns. The 2 bearish reversals also nailed turns.