Education
March 3, 2021

GBPUSD completed its 5 wave drop today and focus is on identifying the end of a 3 wave corrective bounce. The ideal zone for the corrective top is 1.4050-1.4100. A small pullback followed by a rally into that zone is what I’m looking for.
March 2, 2021

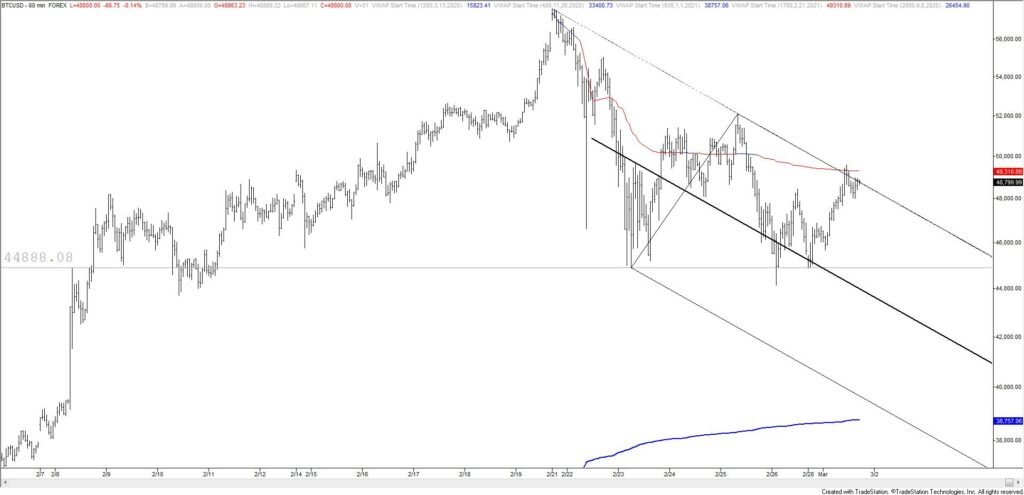
BTCUSD bounced sharply today with stocks and commodity currencies…still all the same trade. Price could turn down right here, which is VWAP from the high and possible channel resistance. At minimum, risk is well-defined for those looking to position for downside in BTCUSD.
February 26, 2021
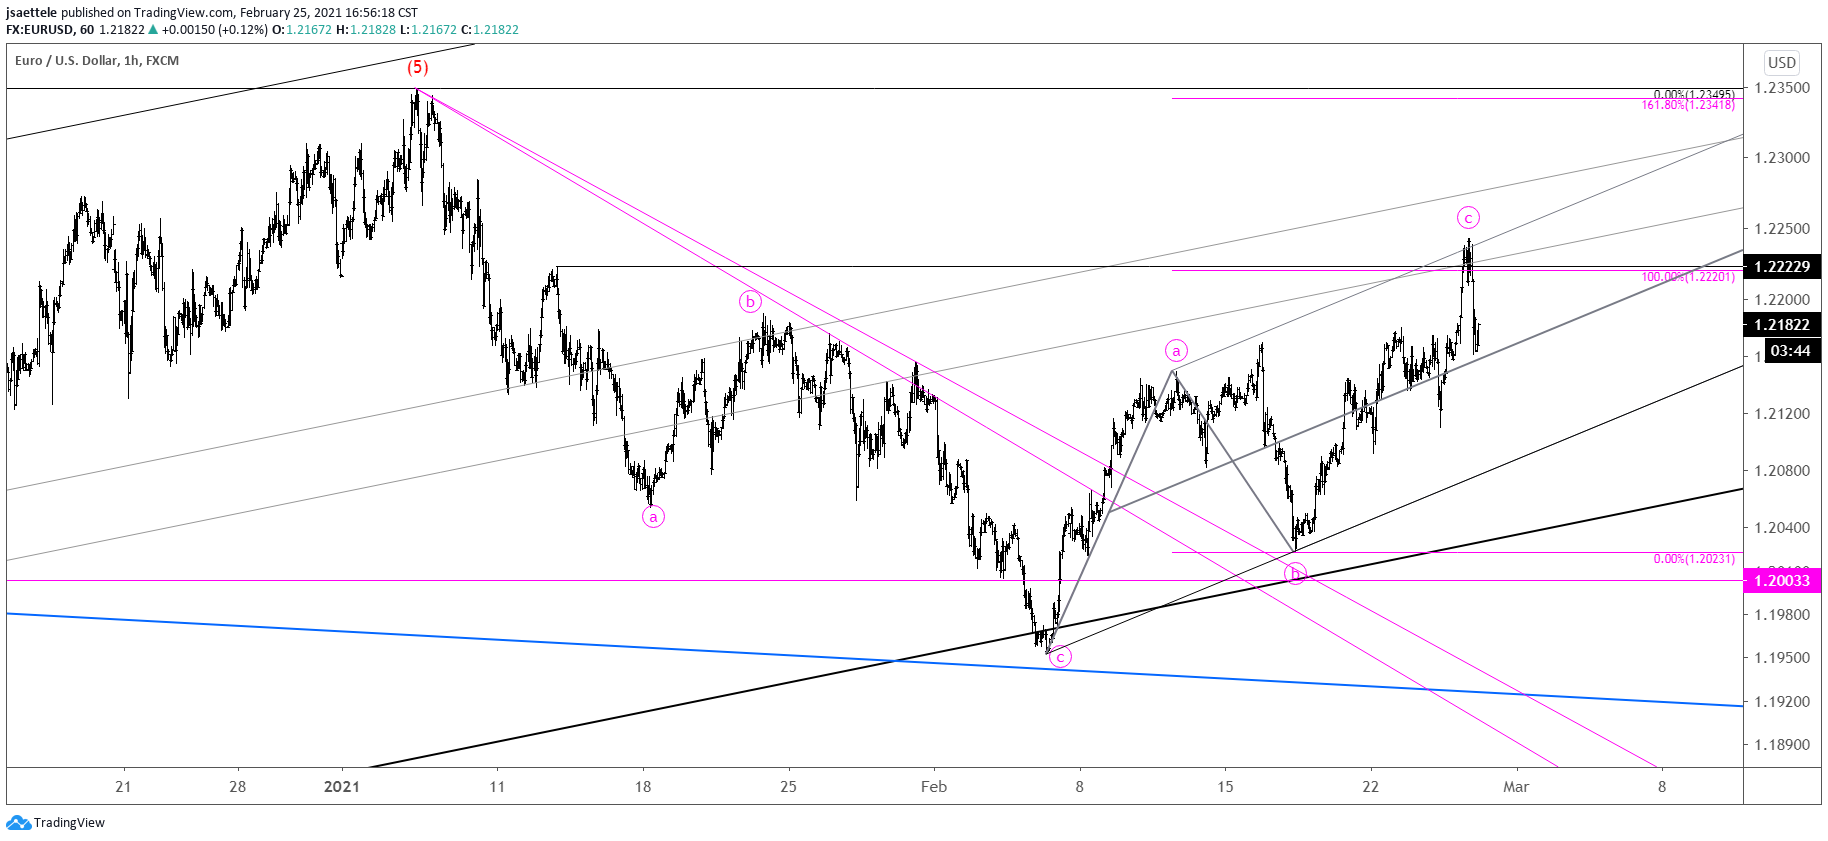
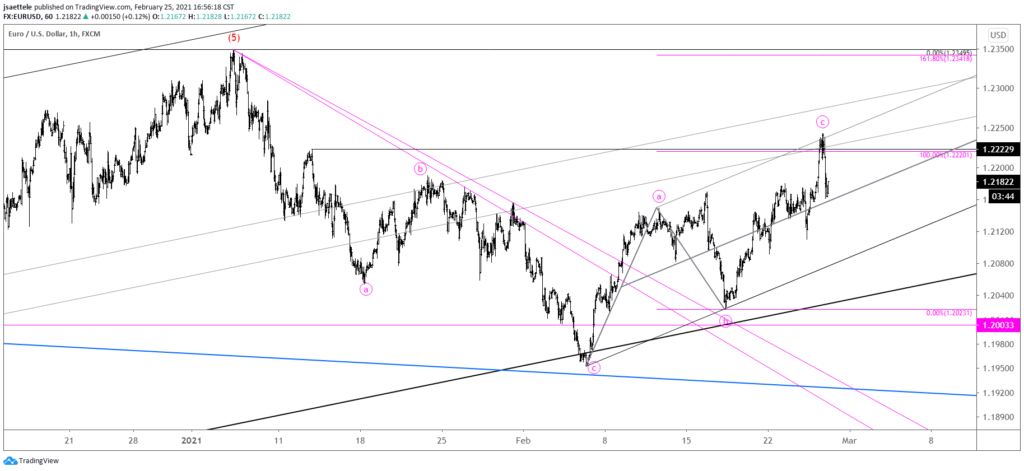
EURUSD spiked into and reversed from the noted 1.2220. My view is that a 3 wave rally is complete from the February low and that either a 3 or 5 wave decline will draw price beneath the February low in order to complete the larger correction from the January high. Short term channel support for a bounce is about 1.2080.
February 22, 2021
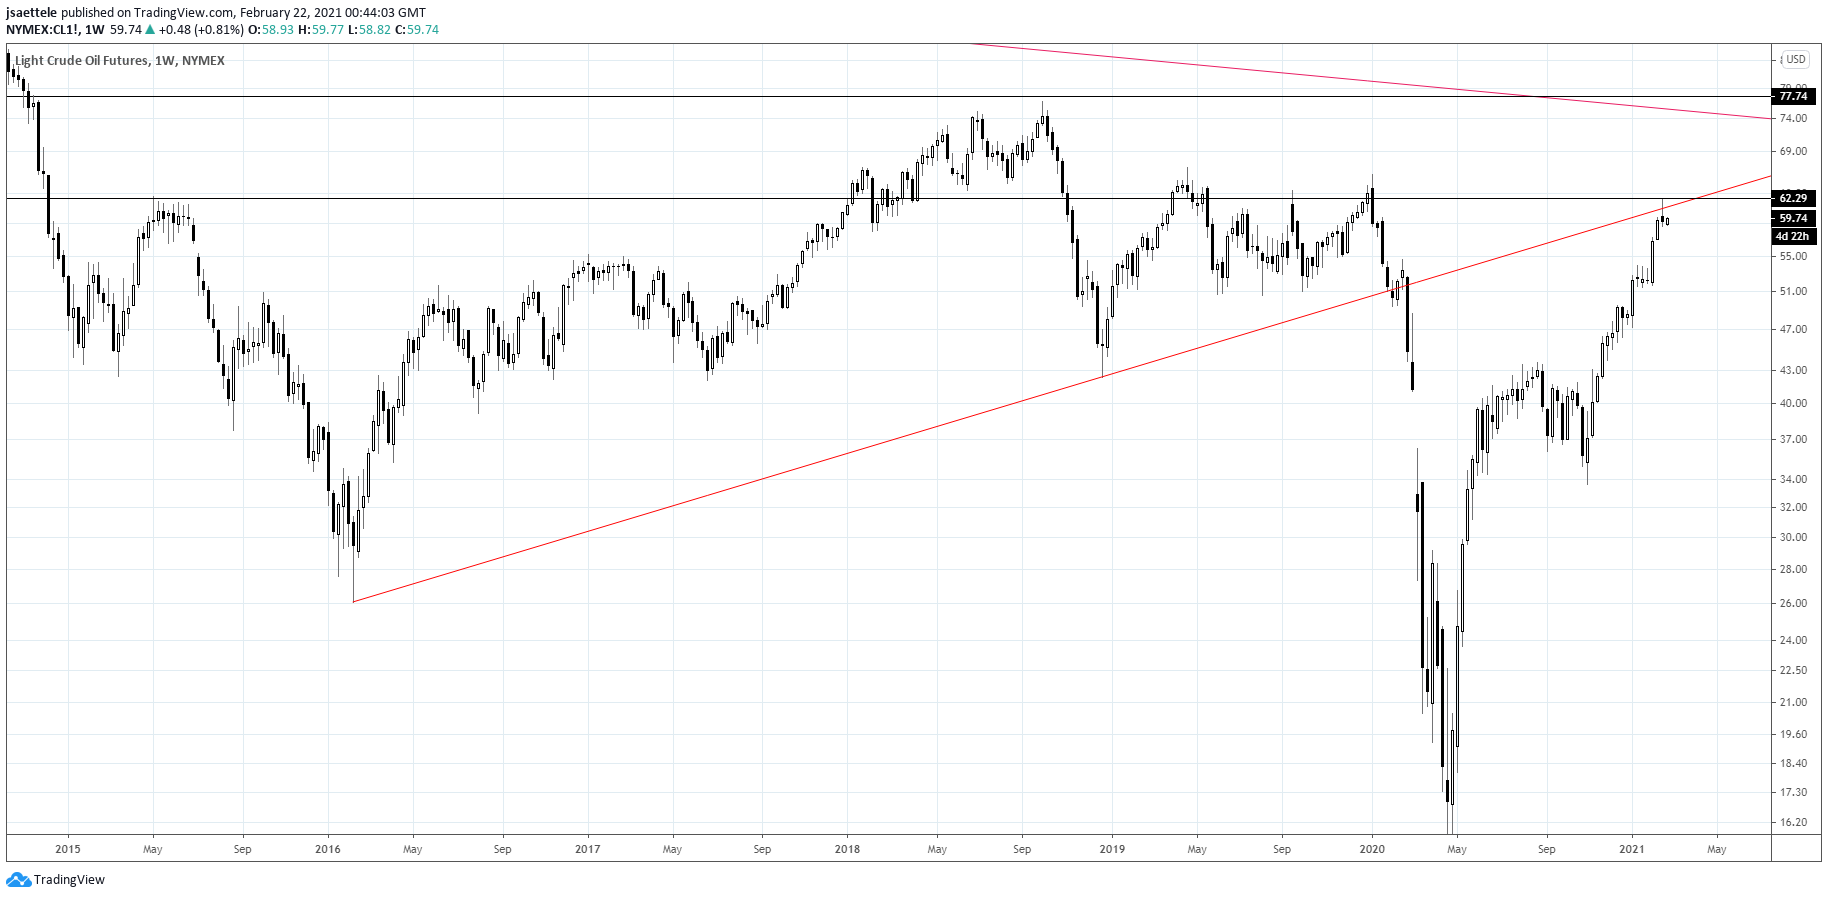
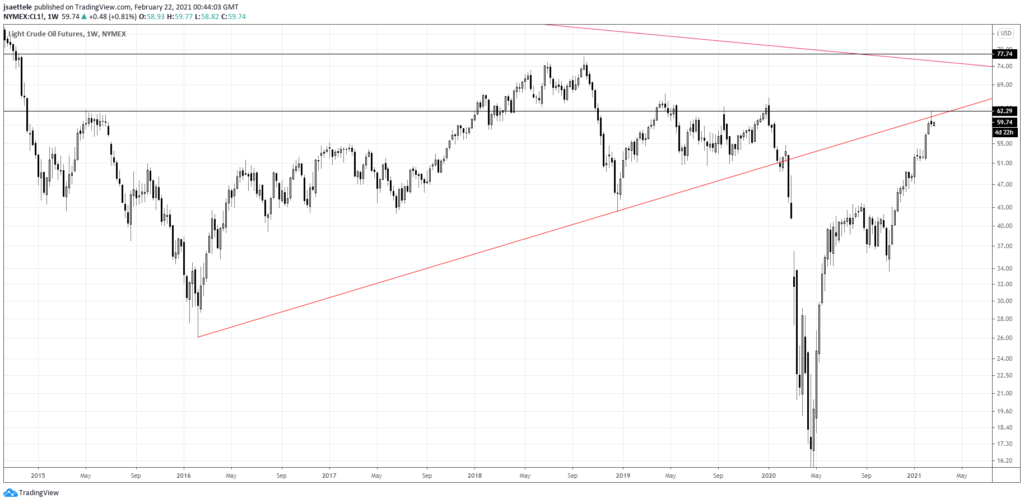
Crude made a weekly key reversal last week at a defined level (underside of the trendline off of the 2016 and 2018 lows). This is also the level that provided resistance in 2015 before the plunge into the early 2016 low. The trend in the inflation trade (basically USD down) is strong but crude could come off from the current level.
February 18, 2021
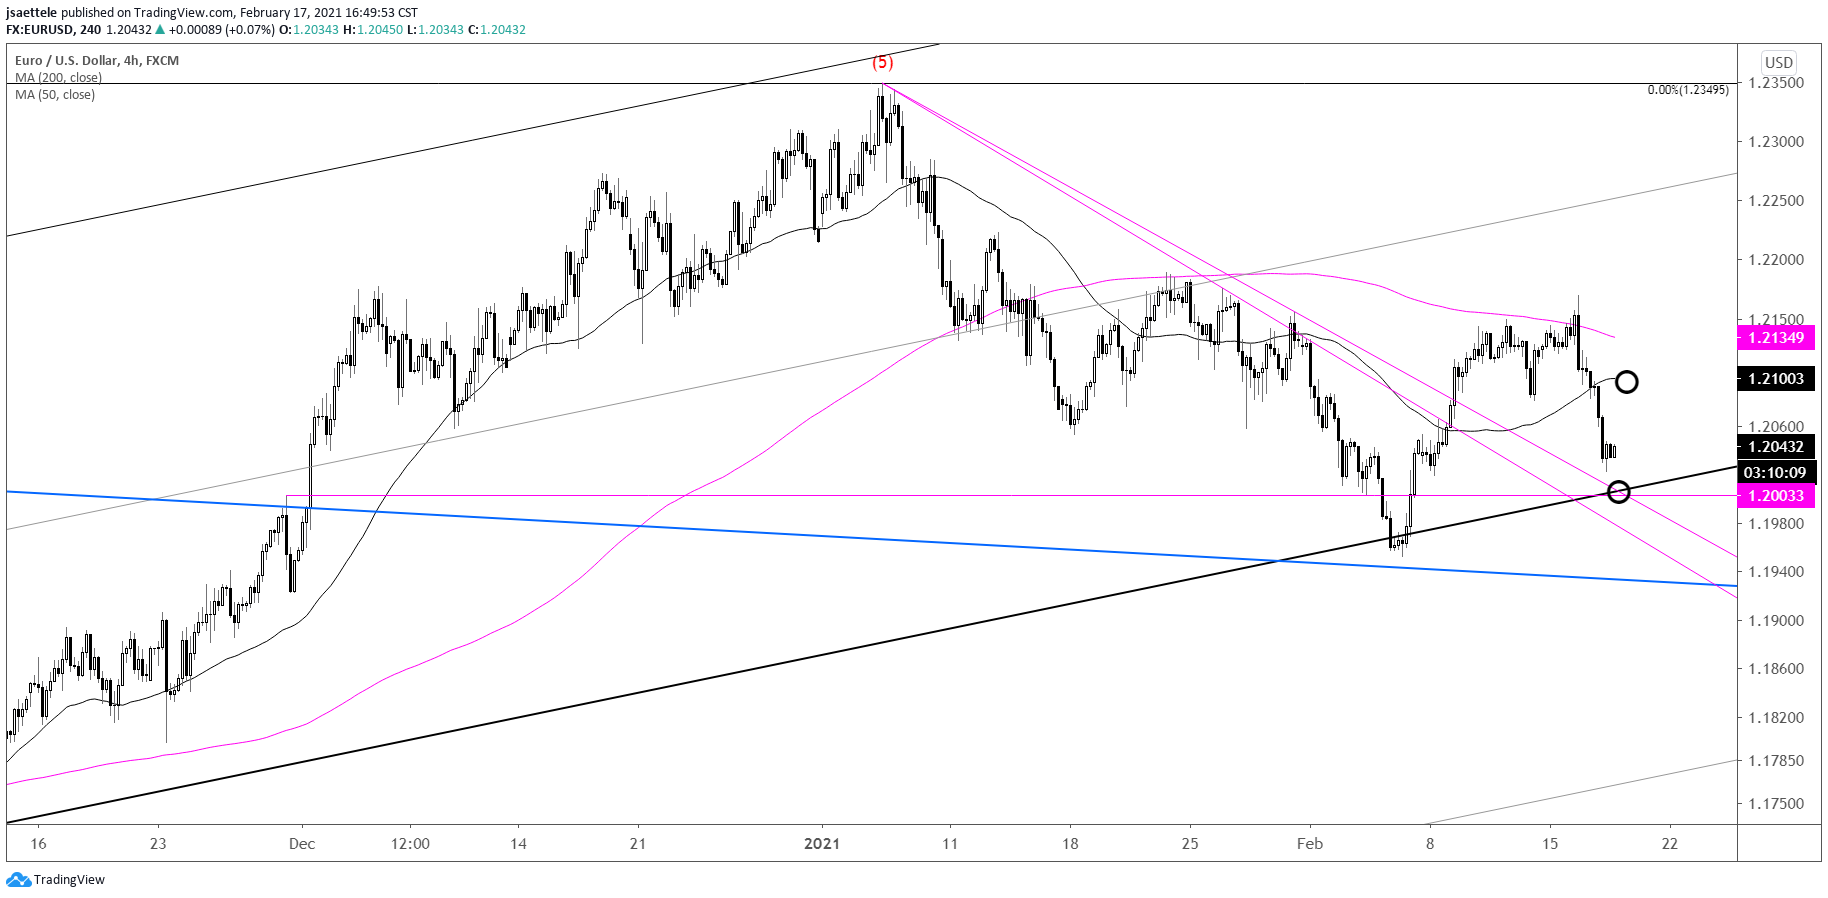
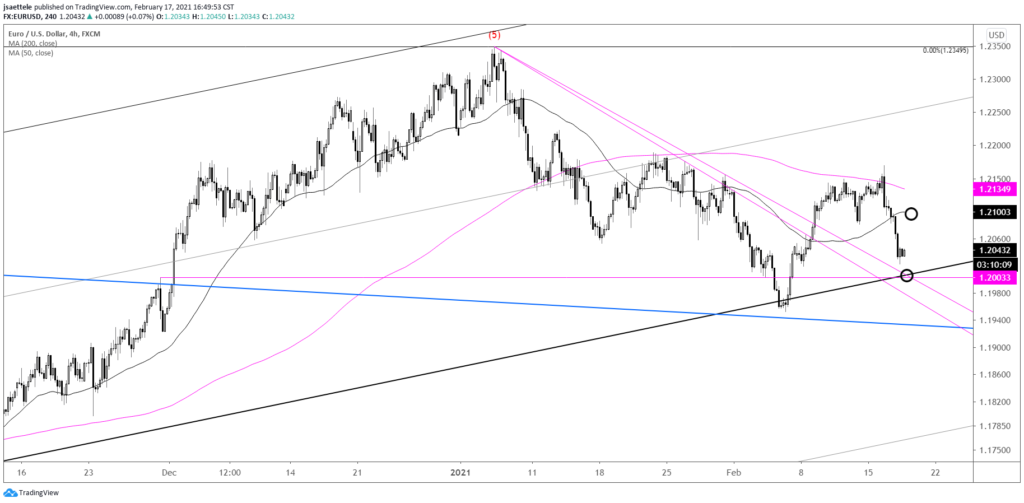
1.2000ish remains a possible bounce level for EURUSD but I’d keep an eye on 1.2090-1.2100 for resistance now too. The level is defined by VWAPs from the November and February lows. These VWAPs were previously support. Now broken, watch the lines for resistance.
February 17, 2021

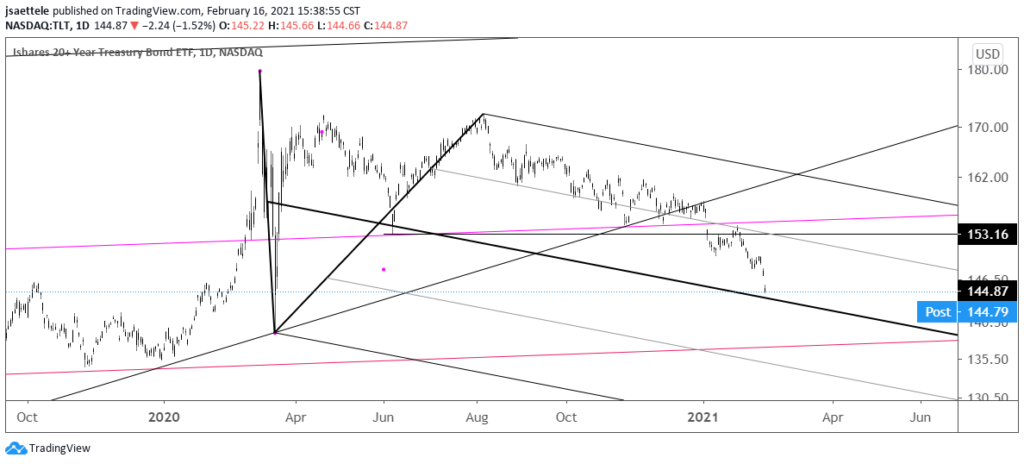
TLT has been tanking but is nearing a possible pivot from the center line of the channel from the March high. Daily RSI is 25.5. Magenta dots on the chart below show when RSI has been 25.5 or lower. Also, the 2016 is 143.36. This is an extremely important chart given the ‘inflation trade’ narrative. A bounce in TLT would indicate a pause/pullback in the in the nearly year long ‘inflation trade’.
February 13, 2021

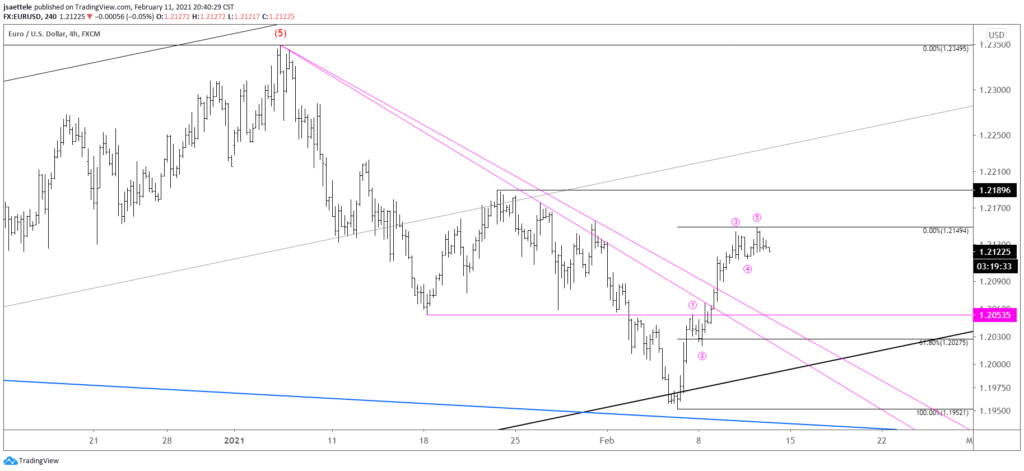
EURUSD traded up to 1.2149 today so a near term top may be in place. The rally consist of 5 waves so expectations are for a drop and then another leg higher. My ‘guess’ is that a prolonged range is underway from the January high. Markets oscillate between trending and ranging periods and EURUSD has been trending higher since March 2020. A reset of sorts is needed in the form of a range. For now, pay attention to 1.2030/50 for support.
February 11, 2021

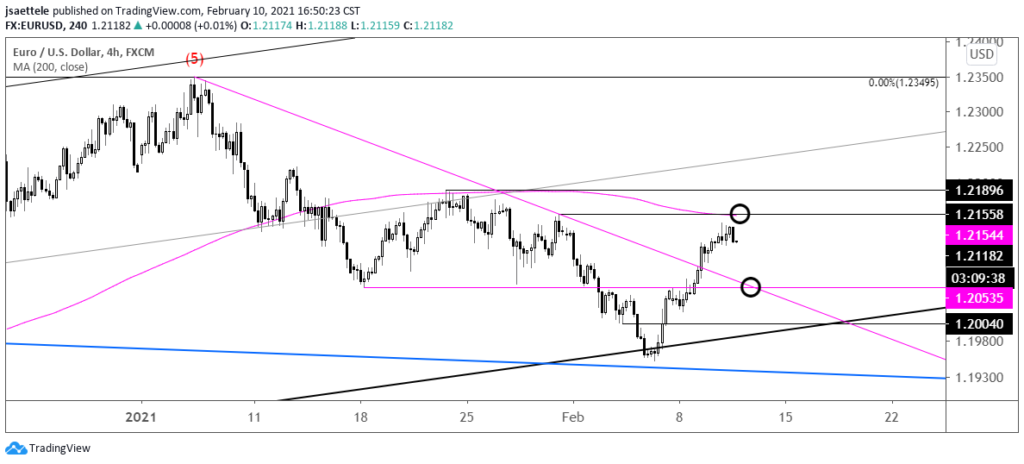
EURUSD traded in a very narrow range today and also made a doji (perfect doji…open and close are the same). Price tagged the month open too (1.2133). The 1/29 high and 50 day average are both 1.2155. Maybe we get a spike into that level before lower? I like leaving a short order at that level. 1.2050s may be support now.
February 10, 2021
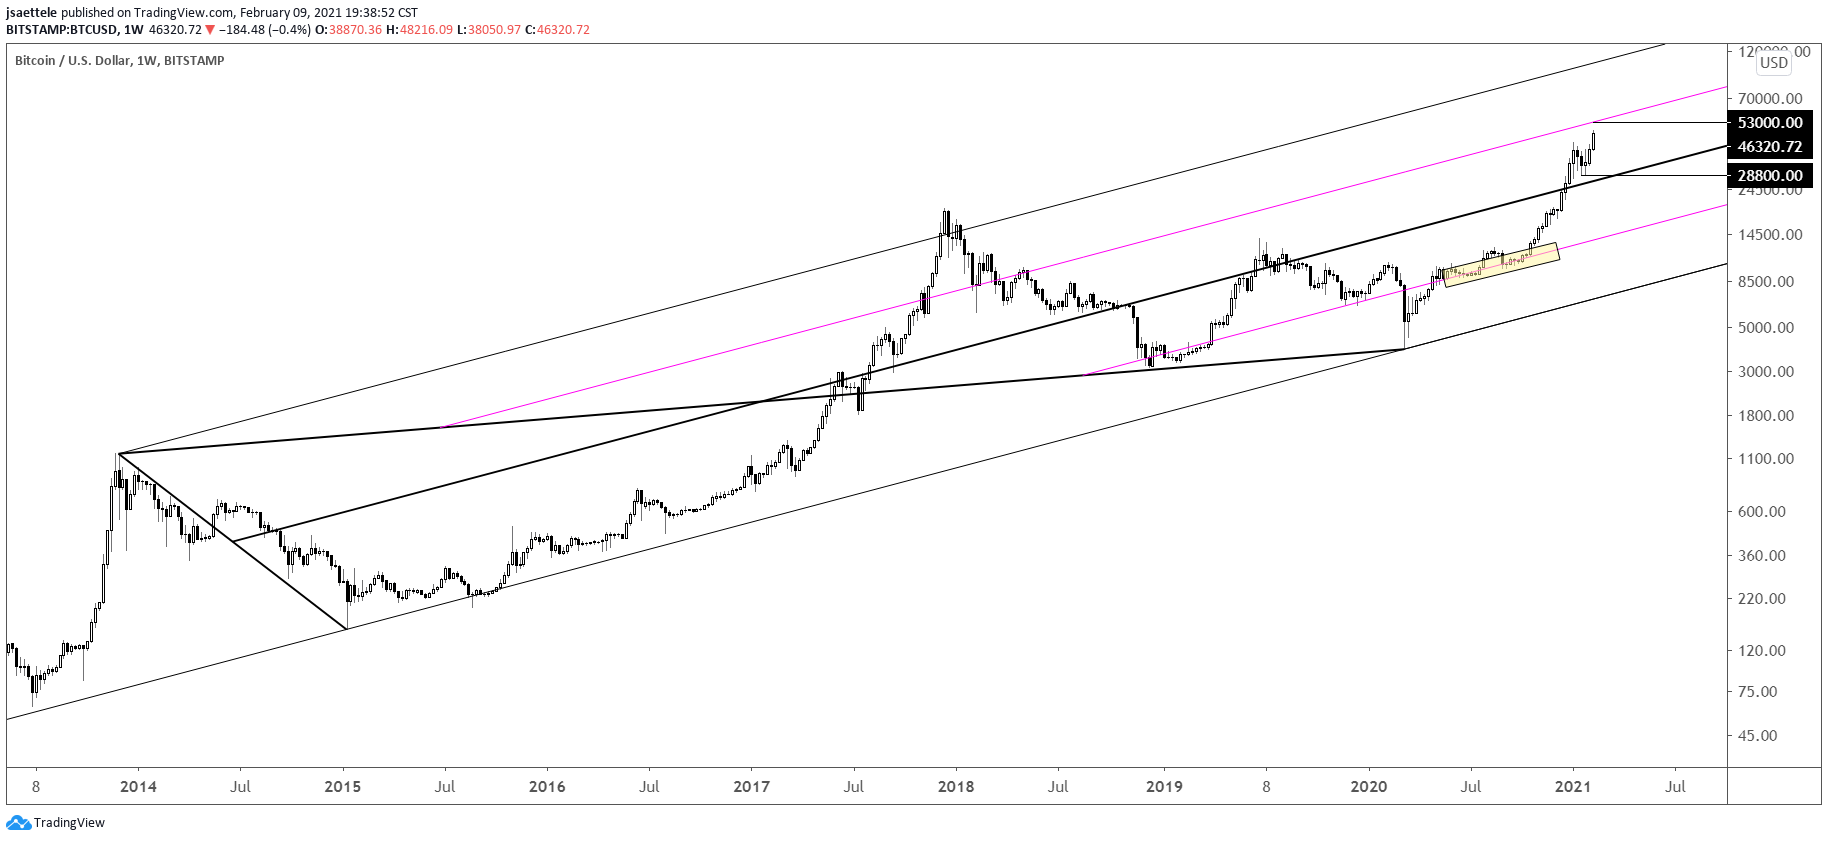
If I look at Bitcoin as nothing more than a liquid asset and apply a channel to price history then 53k (give or take) is a level to pay attention to. The level is defined by the 75 line of the channel from the January 2015 low. As an aside, the Bitcoin bottom then was 1/15/2014…one day before the SNB let the floor go on EURCHF. I bought BTCUSD that day but then sold in May 2017. Worst exit ever? The fact that I think about that now is instructive from a timing standpoint. Anyway, the 25 line was support (highlighted) from May to October last year. As per median line symmetry, the 75 line is expected resistance…which is 53,000.