Education
May 20, 2021

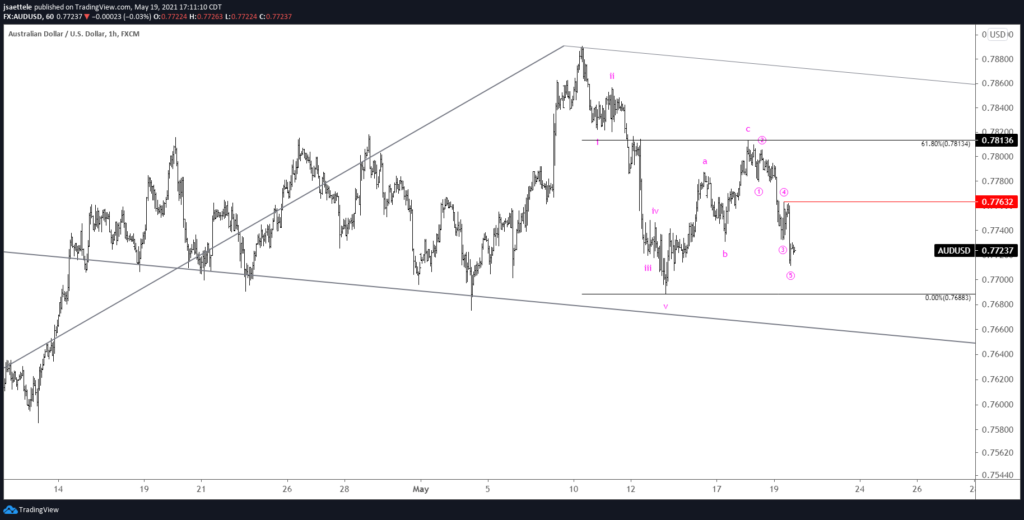
Since the 5/10 high, AUDUSD has dropped in 5 waves, rallied in 3 waves, and dropped in 5 waves at a lesser degree. An Elliott wave textbook! Resistance should be .7760/70 now. Broader downside focus is .7415 (2 legs down from the February high and the September high…see below). 5/18 – AUDUSD tagged .7814 today. Again, this is the 61.8% retrace of the decline from 5/10 and well-defined resistance since early January. This is a great spot for AUDUSD to roll over. .7730 needs to give in order to ‘open the floodgates’. This level is 2021 VWAP, VWAP from the February high, and VWAP from the March low (see futures chart below).
May 5, 2021

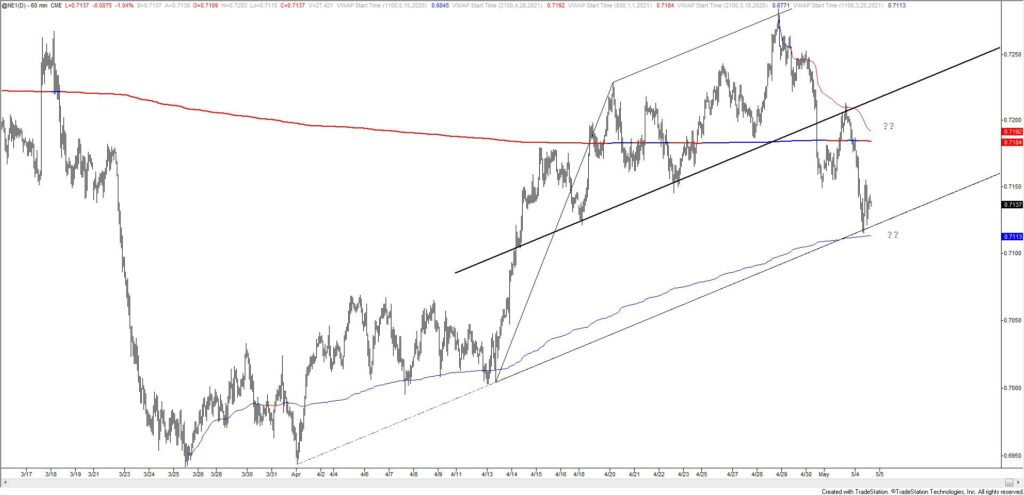
Kiwi has traded in a textbook fashion over the last week or so. Resistance at the channel high…hard break of the center line…center line acting as resistance…and finally the lower channel line holding.
May 4, 2021

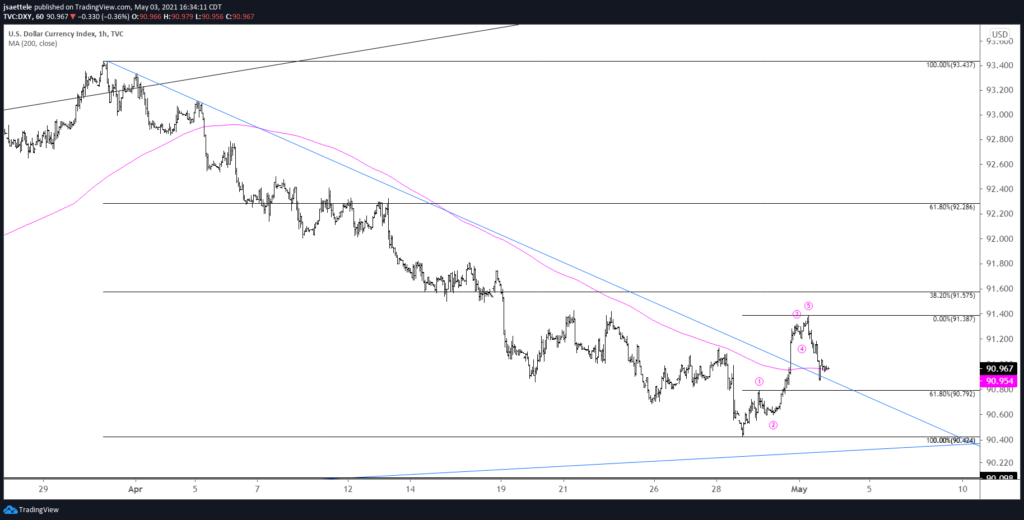
DXY turned sharply higher on Friday but gave back a good portion of those gains today. The rally counts in 5 waves (impulsive) which suggests at least one more leg up while price remains above Friday’s high. 90.79 is proposed support if price slips a bit lower.
April 20, 2021

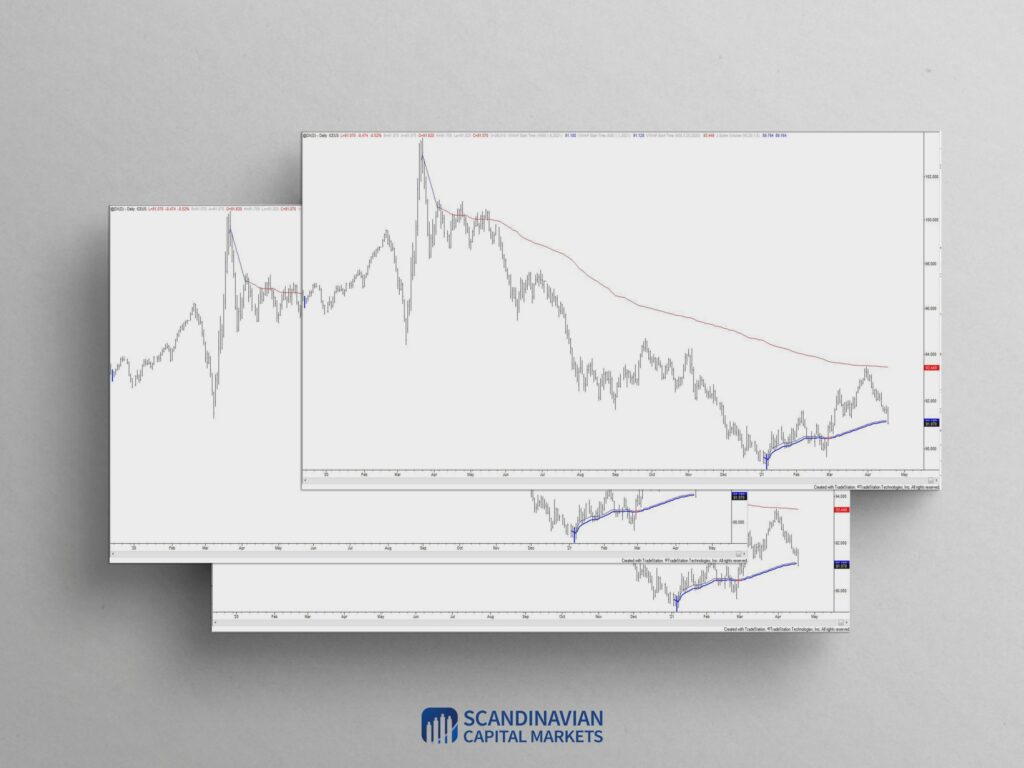
The sharp USD drop on Monday makes me neutral at best for now. I had wanted to see USDOLLAR hold the median line from the multiyear structure in order to stay constructive (see below). That said, DXY has reached VWAP from the January low and USDOLLAR has reached the 3/18 low. The 61.8% retrace for USDOLLAR is slightly lower at 11705. Keep an eye on these levels for possible support.
April 15, 2021

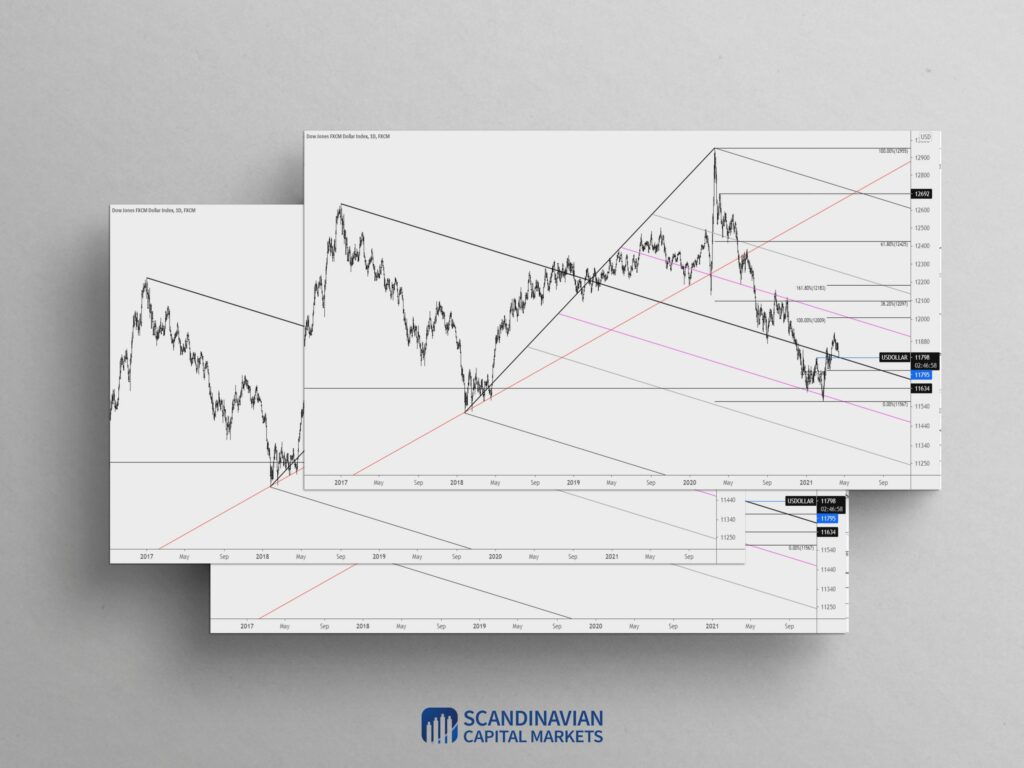
I was wrong to think that the USDOLLAR pullback was complete last week but the long cited 11795 level has been reached. This is a decision point…plain and simple. The level is defined by the early February high and median line of the structure that originates at the 2017 high. The drop also channels in a corrective manner. Bottom line, price needs to turn up now in order to remain constructive on a swing basis.
April 14, 2021
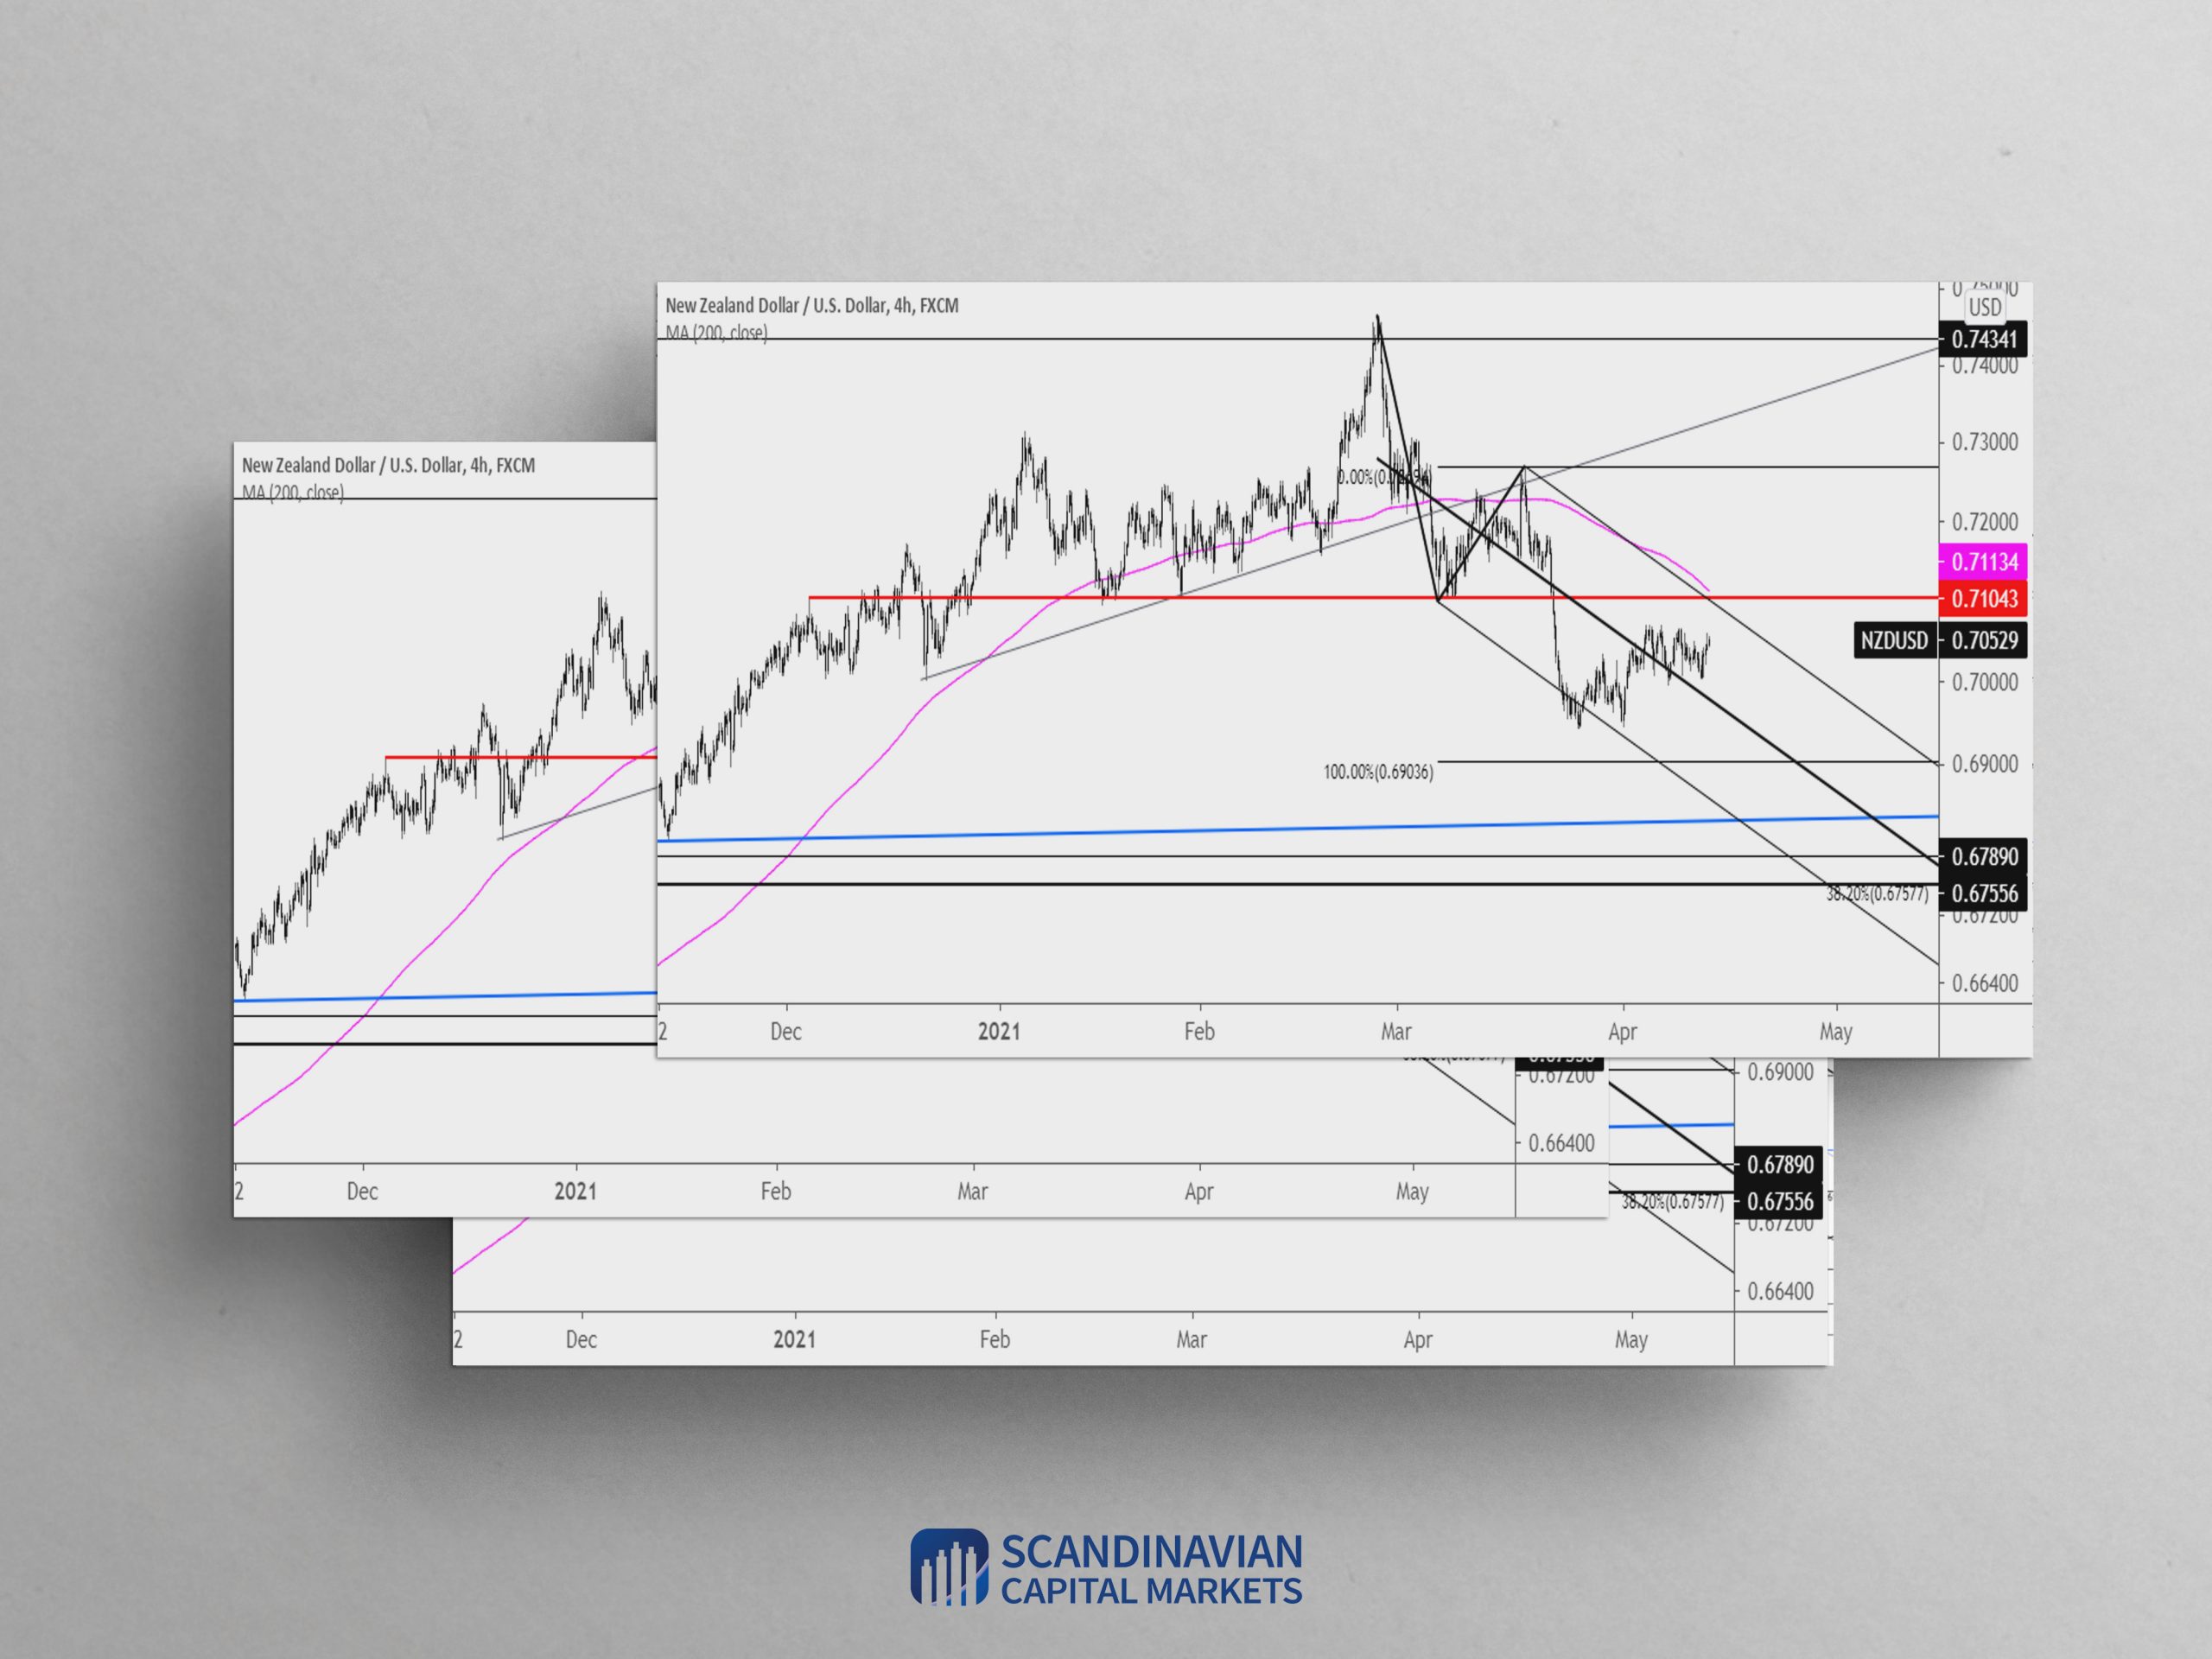
NZDUSD failed to turn lower from the line that extends off of the February and 3/18 highs. The structure from the February high is now a Schiff fork. The upper parallel intersects with the well-defined .7100 level and 200 period average on the 4 hour chart. If NZDUSD is lower, then .7100 is the price to short.
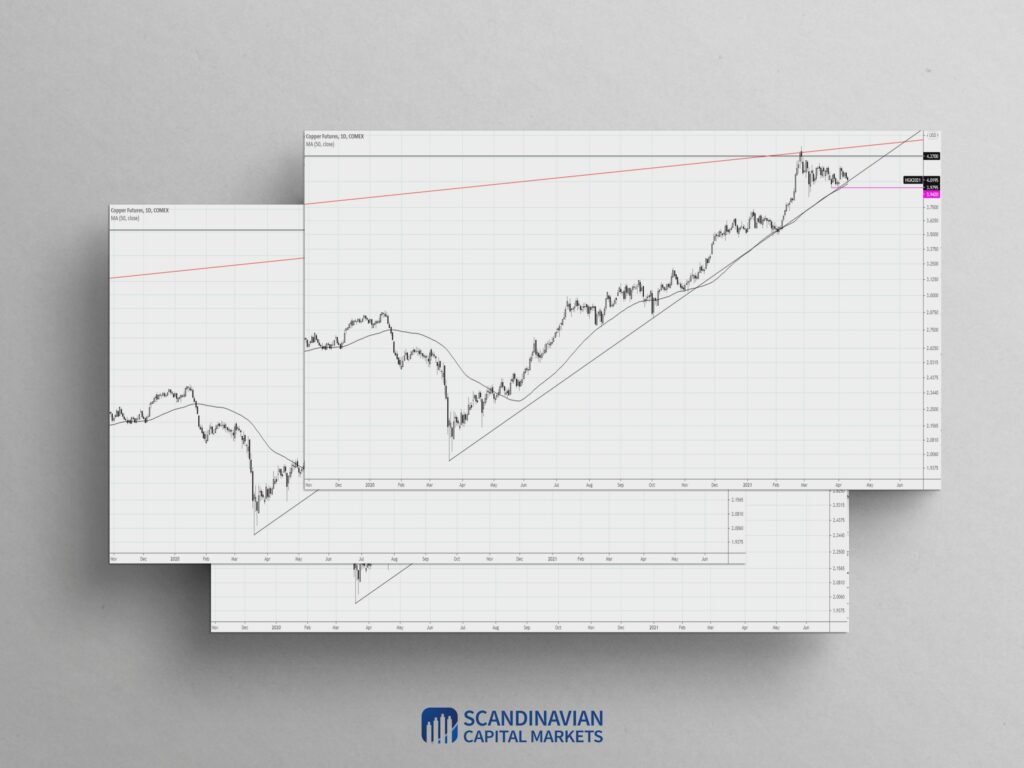
April 13, 2021
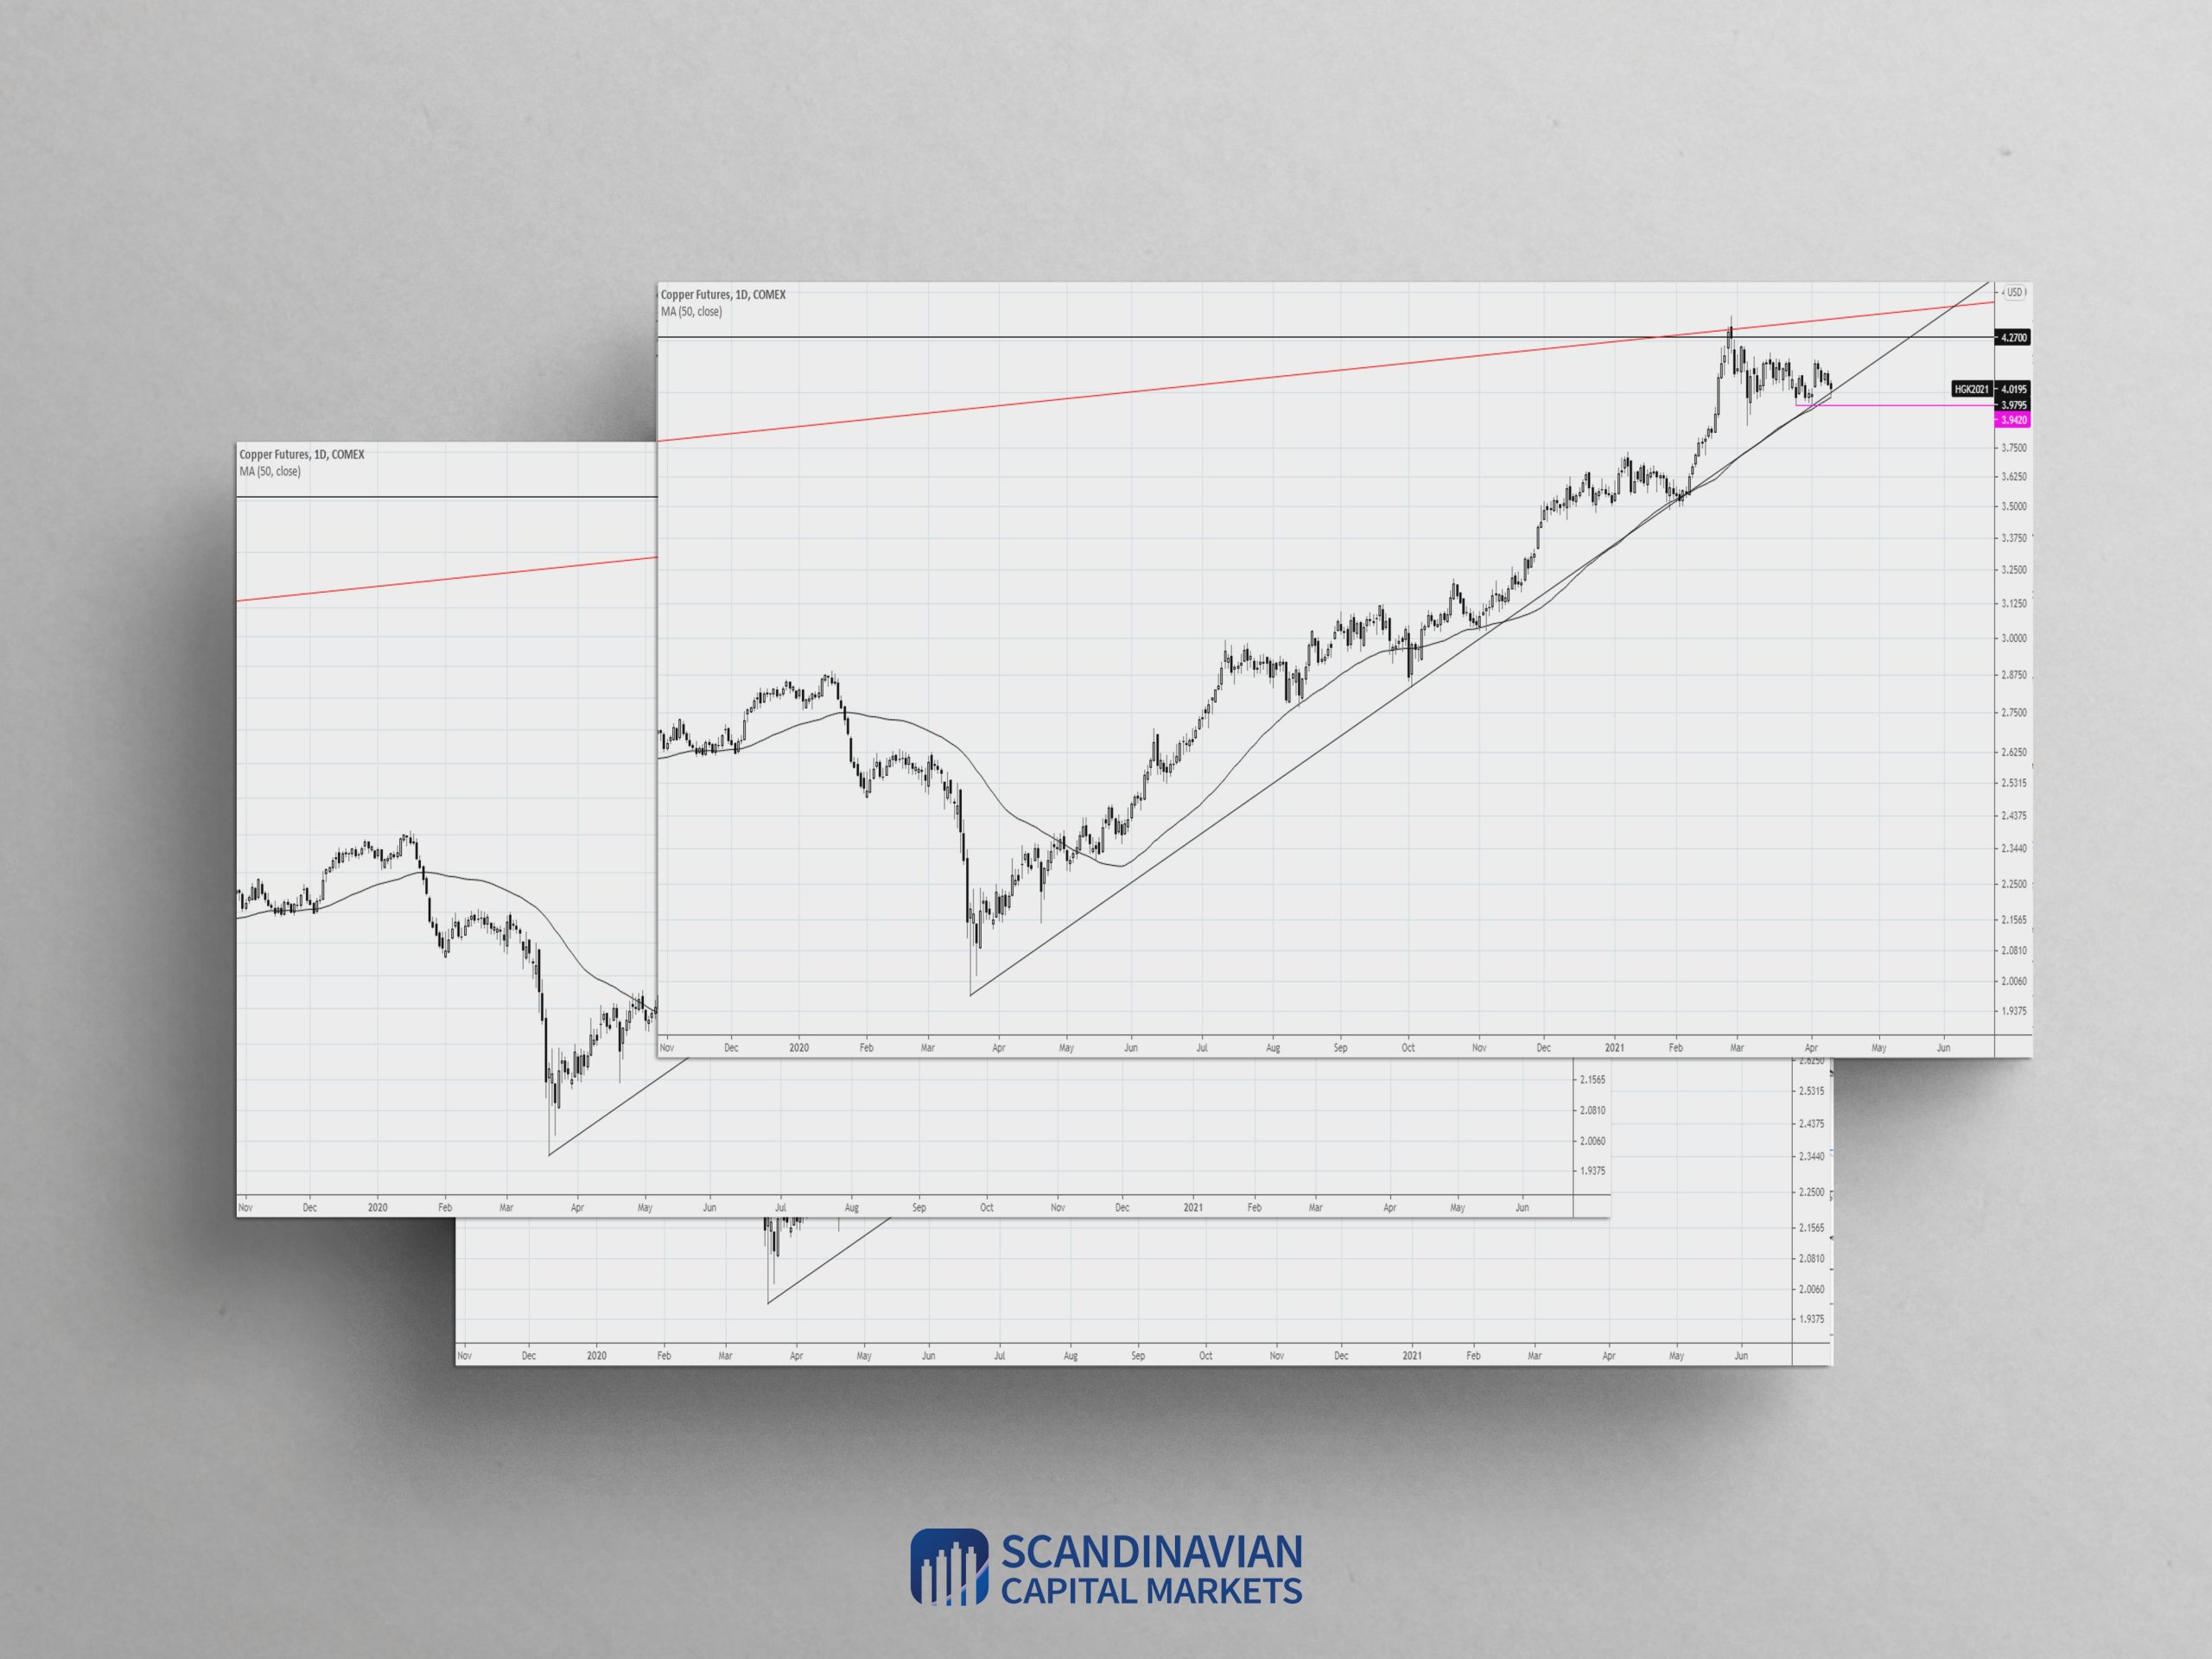
Copper is once again testing the critical trendline from the March 2020 low. This line is reinforced by the 50 day average, which has been precise support since November. I’m waiting for a break lower in order to turn bearish copper.
March 31, 2021
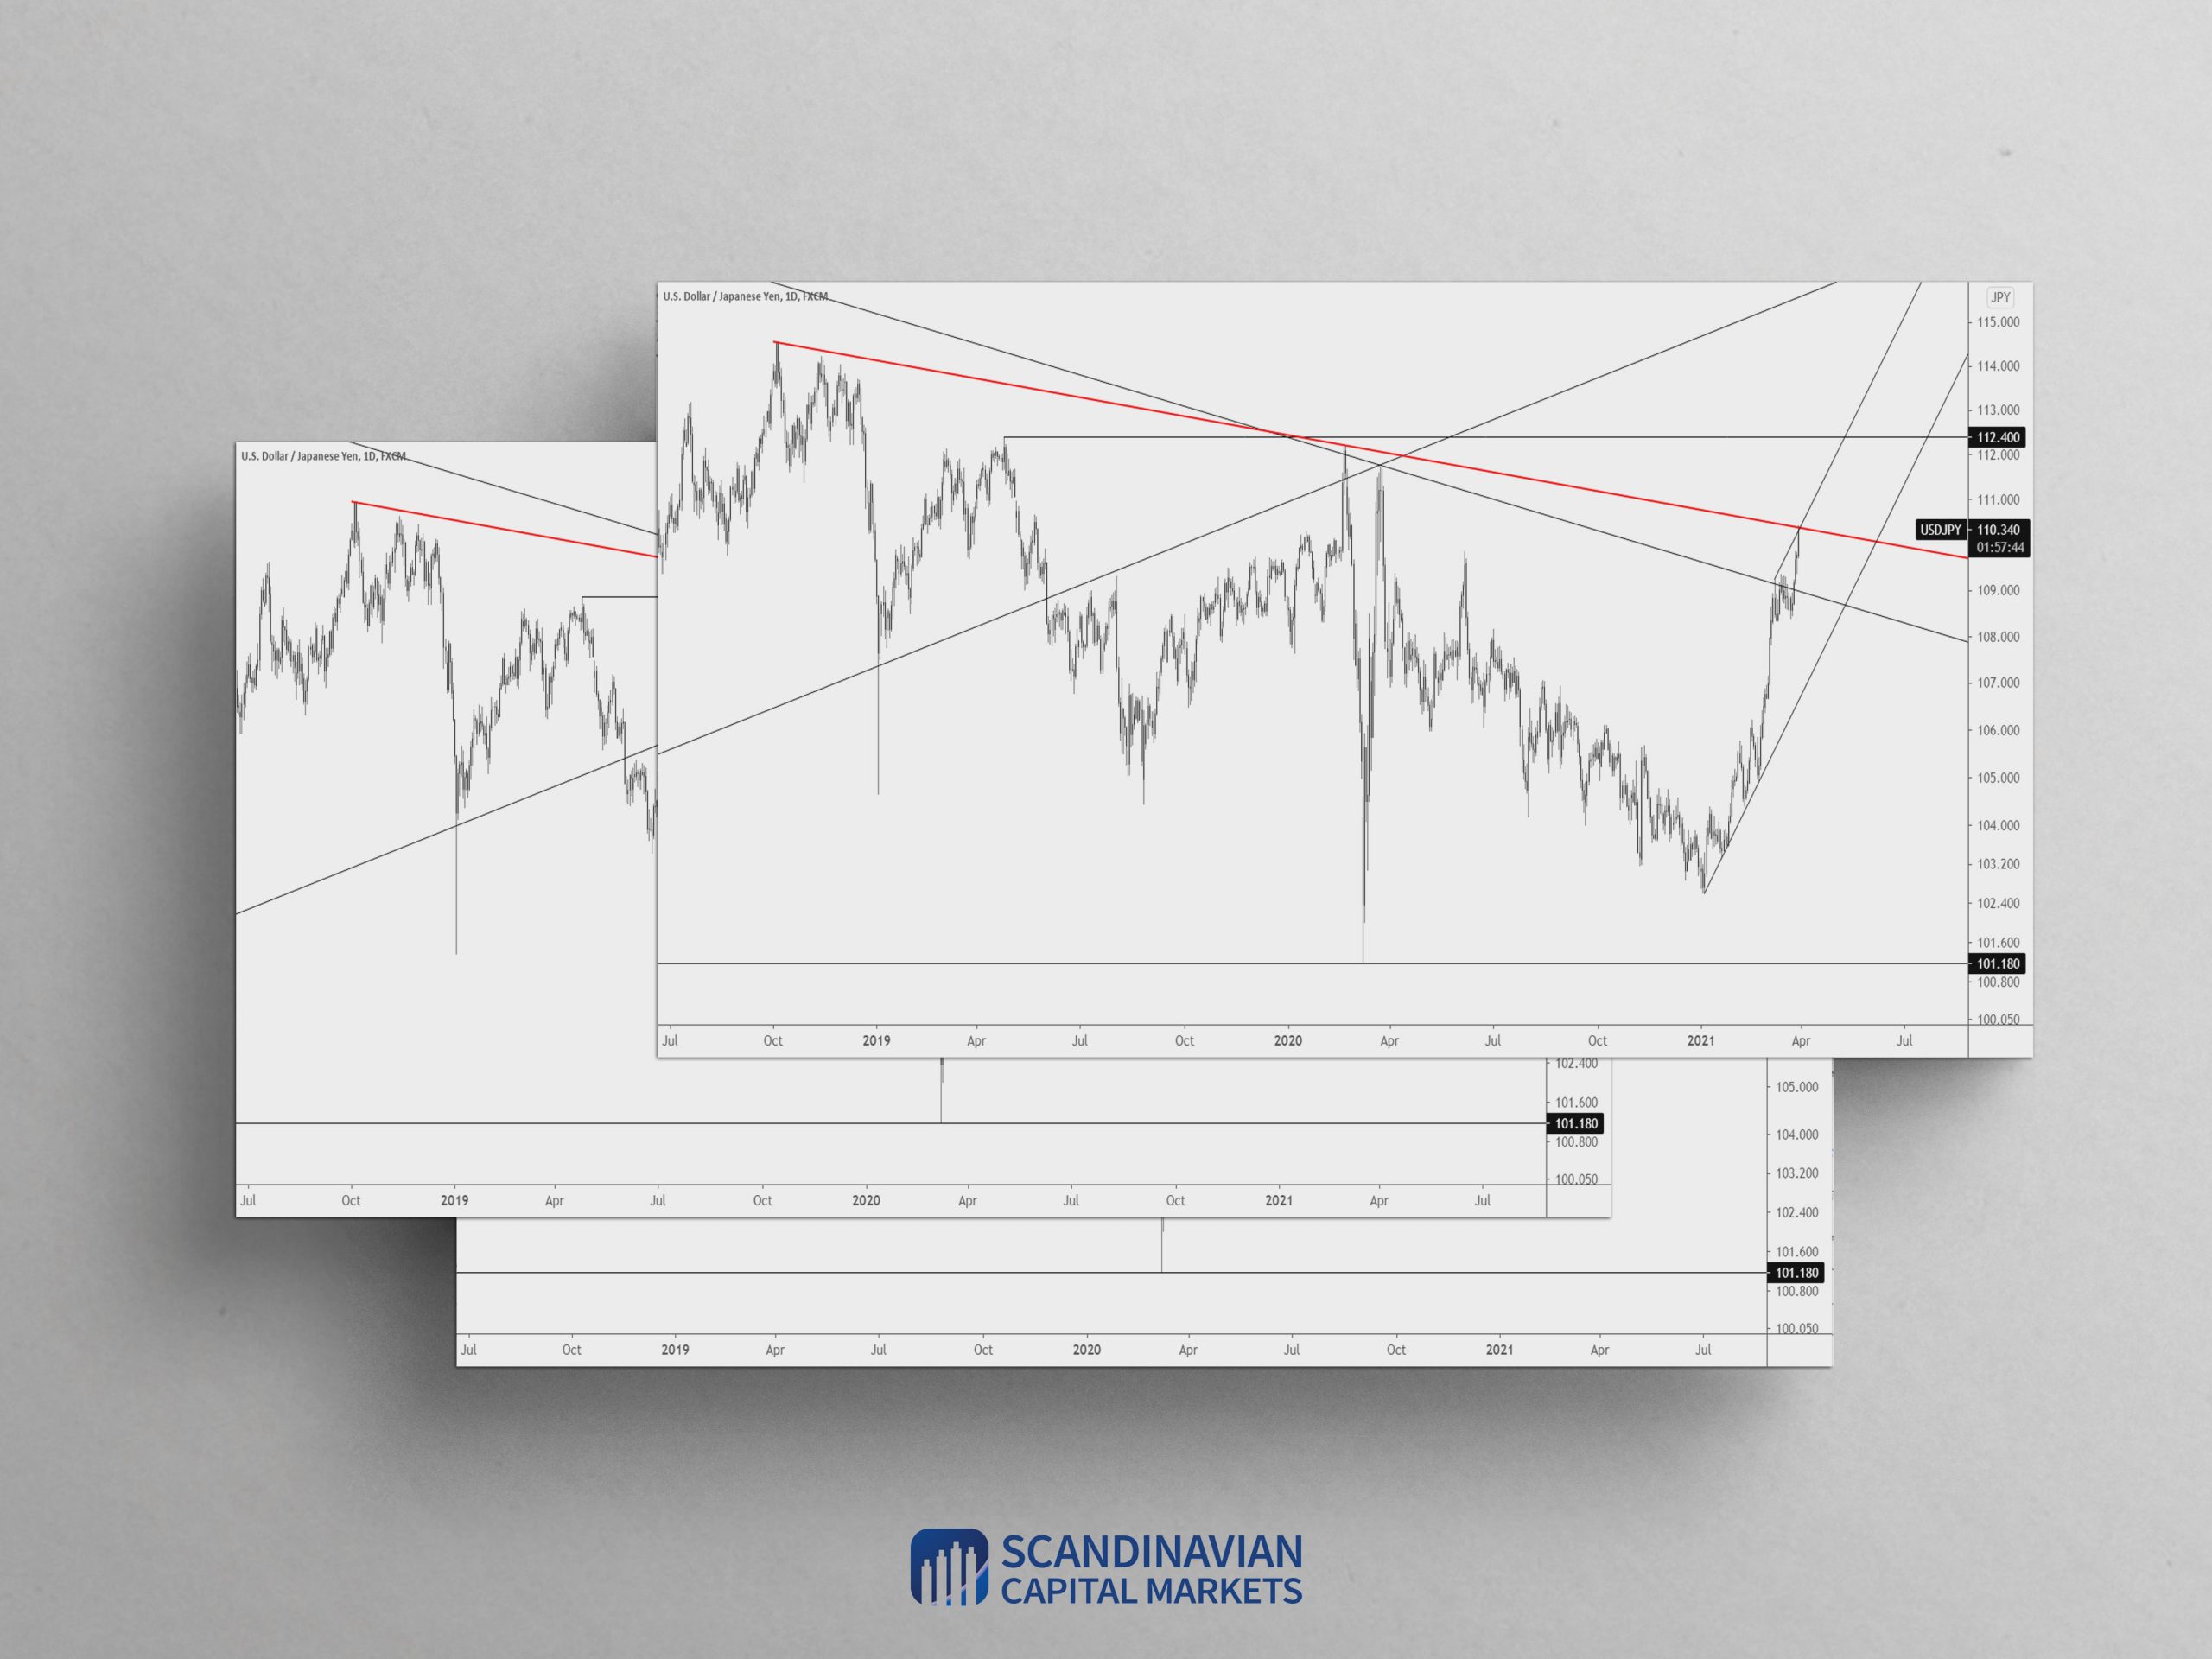
USDJPY continues to rip higher but price has reached an interesting level. The level in question is the line that extends off of the 2018 and 2020 highs. Seasonal tendencies also top this week. This trendline/seasonal combination makes for a great opportunity to fade the move but we need price to suggest that some sort of a top is in place. An intraday volume reversal for example would suffice.