Education
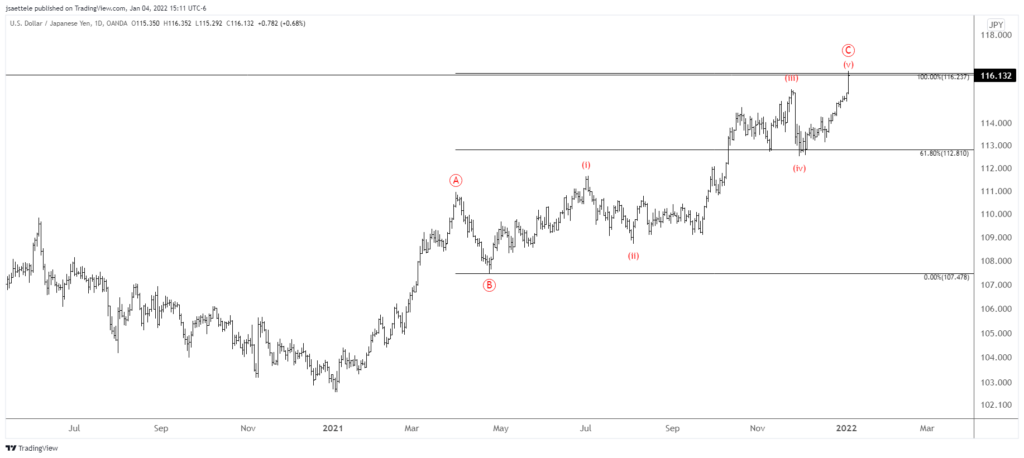
January 5, 2022

Well, the re-test is out of the question but this USDJPY move could be a false breakout. The chart above shows square root levels. Square the year opening price and add/subtract that number in increments. For USDJPY, the square root of 11510 is 107 so the first square root up is 116.17. The idea is to look for a turn at the first square root level during the first week of the year in a market that is already extended. Several examples are below. An Elliott case is also made for a top as the rally from January 2021 consists of 2 equal legs (log scale). This chart is below. An objective trigger isn’t present yet.
December 17, 2021

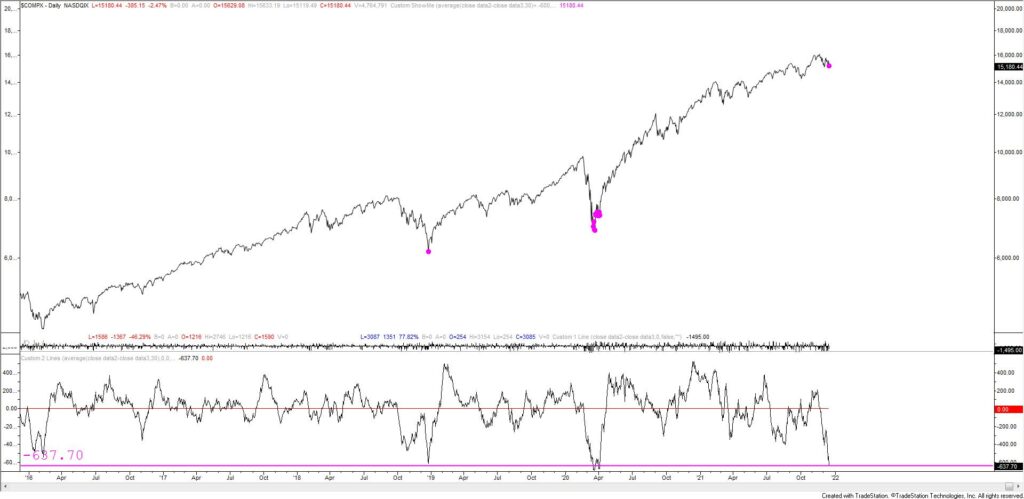
The equity ‘market’ has felt odd recently. A look beneath the surface confirms this suspicion. The 30 day Nasdaq advance-decline line is plotted below the composite index. The AD line closed at -637 today. The magenta dots indicate readings of -600 or lower. Previous readings this occurred at the Dec 2018 low and for several weeks in March-April 2020 (the first reading was 3/18/20). Prior to the last few years, readings this low occurred in October-November 2008 and during the 2000-2001 decline! Those periods are shown in the charts below. So, the A-D line is ‘oversold’ yet the QQQ closed a bit more than 5% off of the all time high today. All of the prior ‘extreme’ AD readings occurred after for more meaningful declines. The only takeaway I have is that if the index continues to decline but the A-D line improves then look out below because the next low won’t be until the next extreme A-D reading.
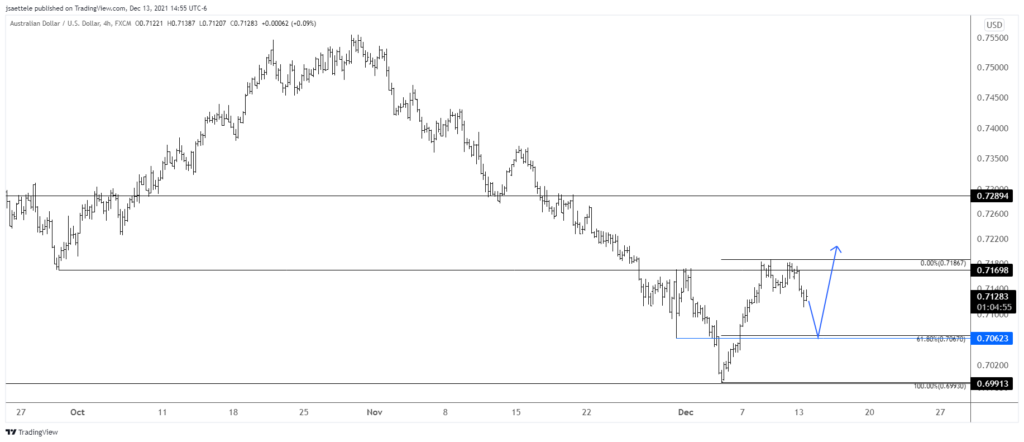
December 14, 2021

AUDUSD has pulled back following a slight push above .7170. My view is that the decline is corrective. The 61.8% retrace is in line with the 11/30 low at .7060s. That sticks out to me as the ideal spot for support.
December 9, 2021
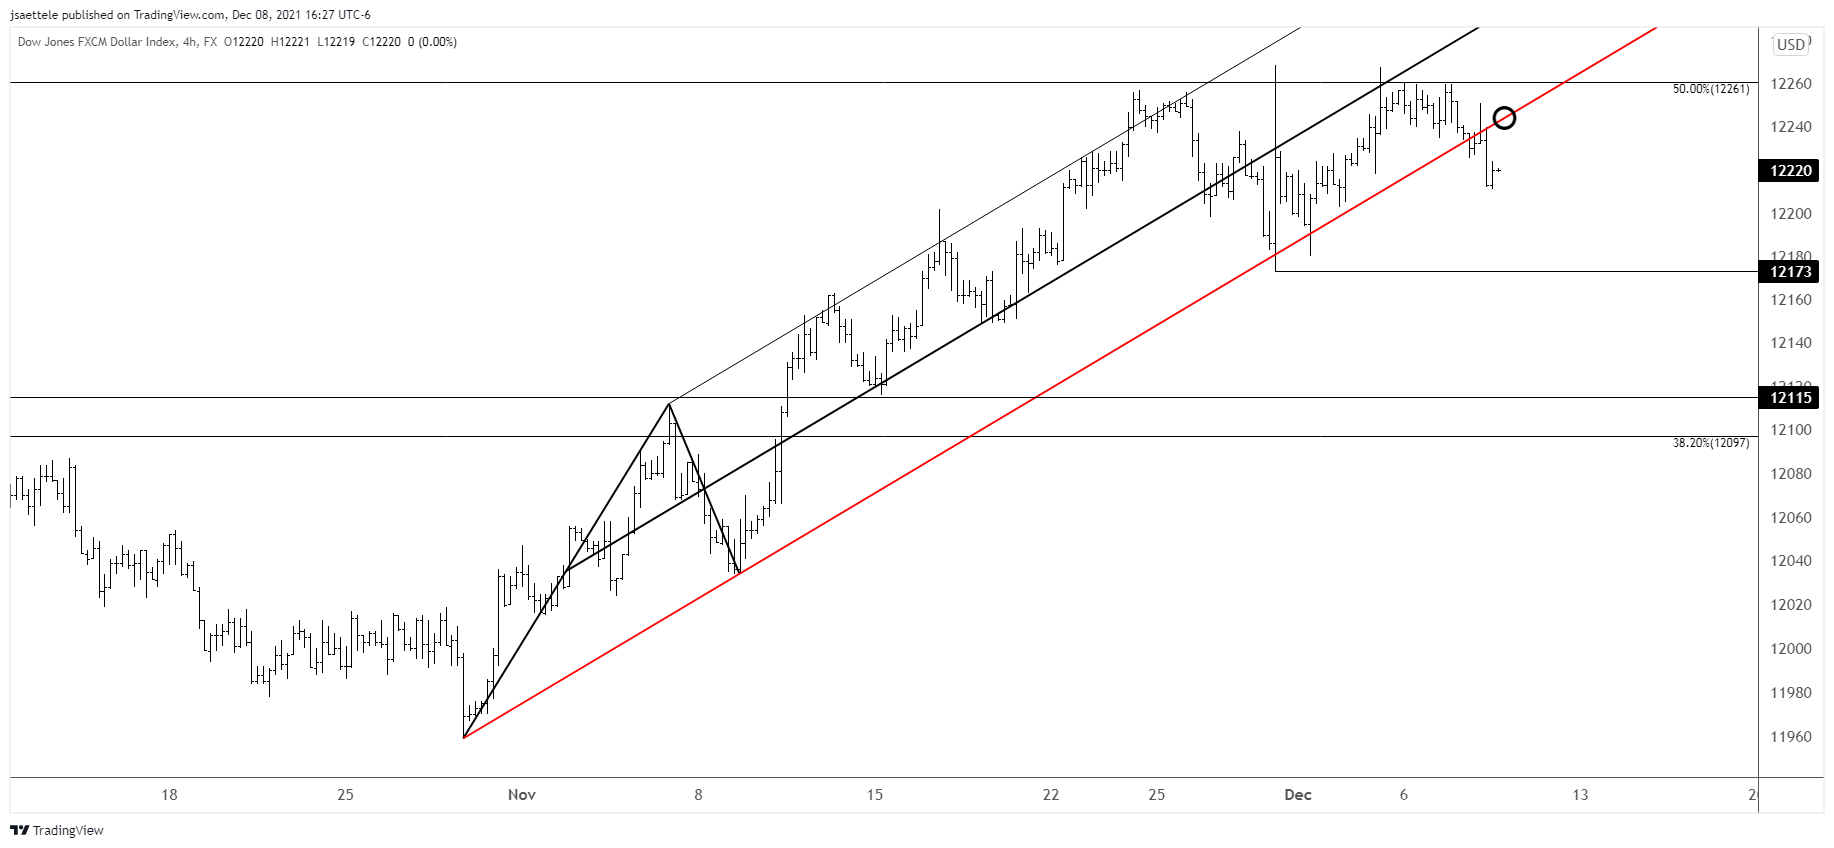
USDOLLAR broke the channel! The development suggests that the broader trend is lower. If ‘lower is legitimate’ then the underside of former channel support should provide resistance near 12245. We’ll worry about downside levels of interest as the situation evolves.
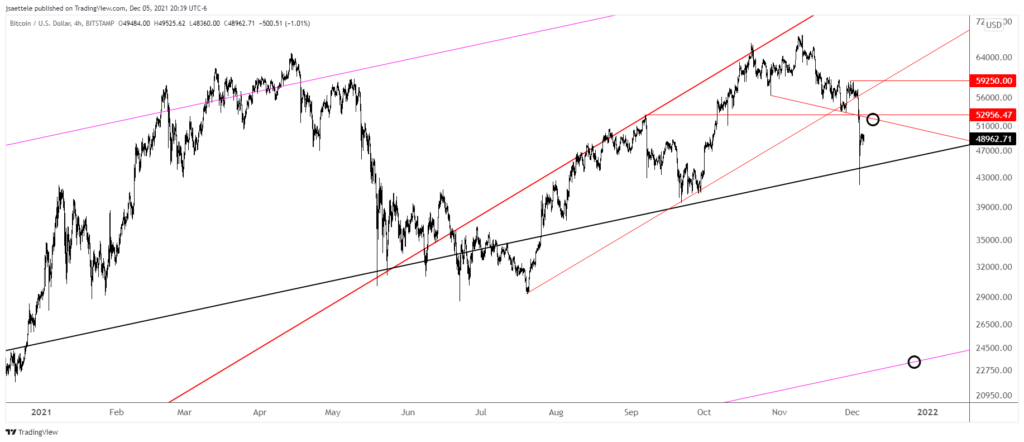
December 6, 2021

That 11/10 reversal nailed the high. From high to low, BTCUSD dropped 39%. The low over the weekend was at the center line from the channel that originates at the 2015 low. 53000 has been a key level since September and I’m watching for resistance at that level. With the low at the center line however, watch for support at 45000-46000. An aggressive bearish target on a break of the center line is 23000. The longer term picture is below.
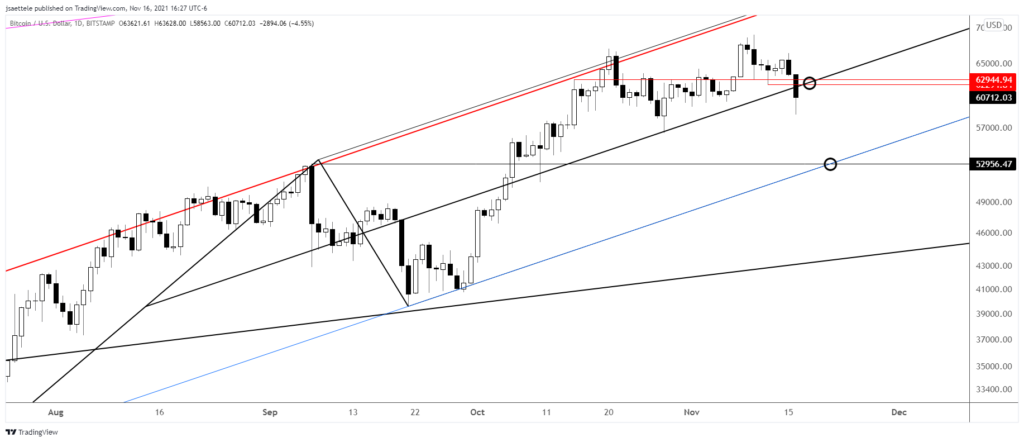
November 17, 2021

BTCUSD has followed through on its 11/10 reversal. I love this setup. Price has broken the median line, which is now proposed resistance along with the 11/12 low at 62295. Initial downside focus is channel support (blue line) in the 52000s. A longer term view is below.