Education
July 1, 2020
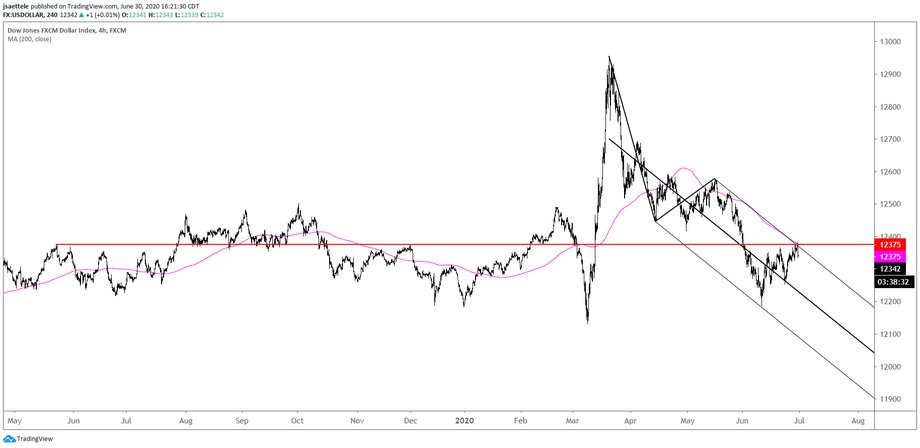
USDOLLAR traded 12383 today, not quite reaching the proposed resistance zone. However, that may be the end of the counter trend bounce. Price reversed right at the upper parallel from a Schiff fork, the 200 period average on the 4 hour chart, and at a level that has been support and resistance since May 2019 (red line). As long as today’s high is in place, risk is lower in my opinion.
June 30, 2020
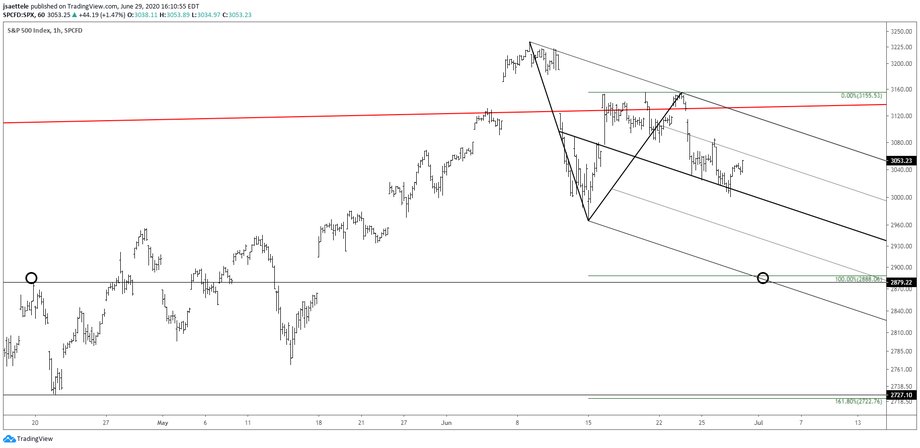
Trading the last few days in indices and FX is best described as a summer lull. That said, SPX focus remains on 2888. Price has respected the short term median line and 25 line the last few days. Expect acceleration lower in the median line breaks. I have no opinion on whether or not the 25 line continues to act as resistance. If it does not then the upper parallel should be watched for resistance near 3120.
June 26, 2020
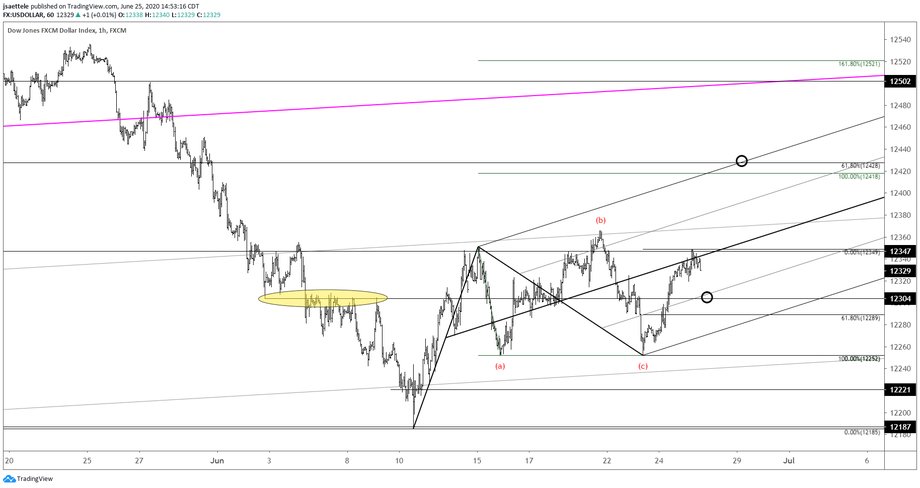
I’m looking at short term wave counts today in USD indices and the 3 cleanest USD pairs from a short term perspective. USDOLLAR focus is still on 12418/28. A flat pattern unfolded from the 6/15 high. The rally from 6/23 is impulsive so focus is on buying support, probably in the 12289-12304 zone.
June 25, 2020
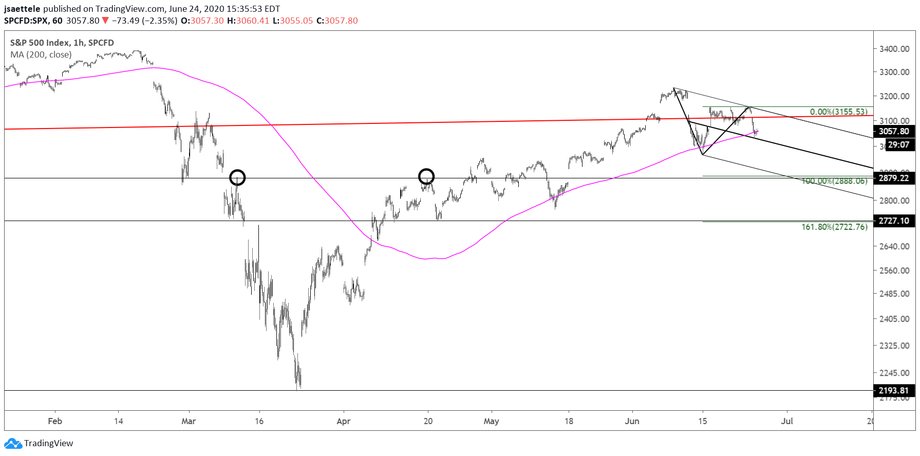
SPX initial downside focus is 2888, which is 2 legs down from the June high and a well-defined horizontal level. Notice how price churned around the red line on this chart for most of June before turning sharply lower today.
June 15, 2020
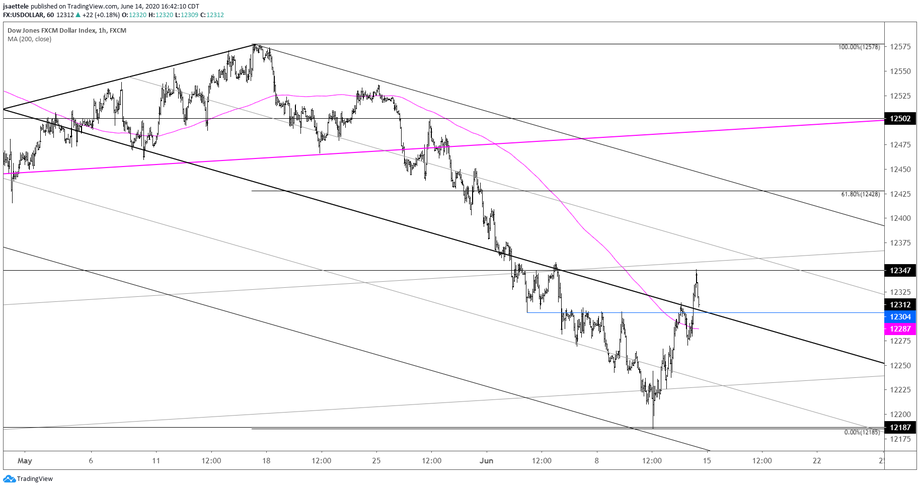
My view is that the USDOLLAR bounce is counter trend but it should carry higher before rolling over. The upper parallel of the Schiff fork is a candidate for resistance along with the 61.8% retrace of the decline from 5/18 at 12428. Watch for support from 12304 (more or less now).
June 13, 2020

Scand.Ex is pleased to present the next video with trading analysis by Jamie Saettele, our Chief Technical Analyst.
June 11, 2020

QQQ is running into lines that extend off of highs over the last 9 years. A close-up view is below. The red line extends off of the December 2014 and March 2018 highs. That line was resistance for the August 2018 and February tops. It was reached today. The line that originates at the February 2011 high is slightly higher…about 251.70 in QQQ.
June 10, 2020

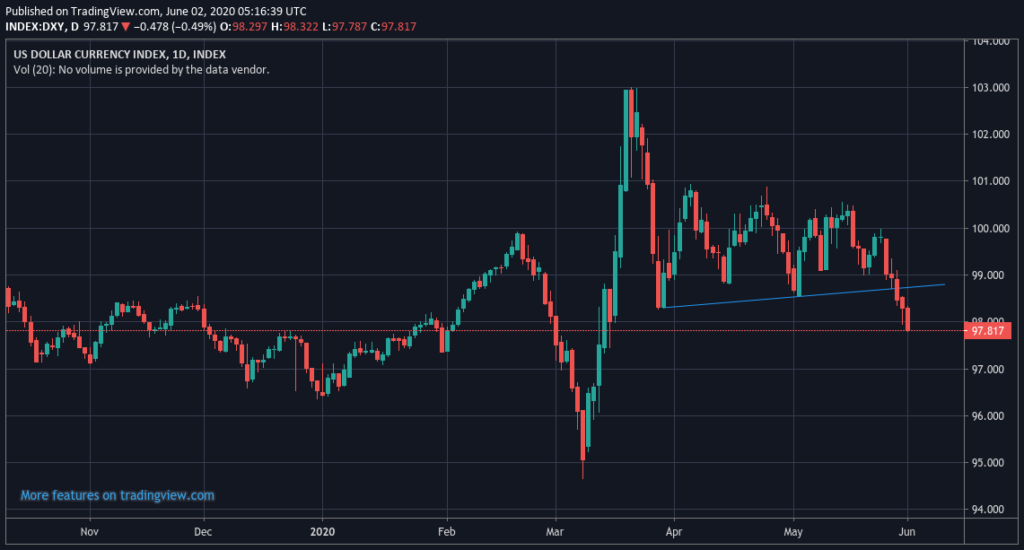
Stephen Roach, former Morgan Stanley economist and currently employed by Yale, published A Crash in the Dollar Is Coming yesterday. He may be correct but these types of articles are usually published at near term price extremes (in this case a USD low). Technically, this is the perfect spot (December low) for a bounce. Also, DXY made a slight new low today but EURUSD did not make a new high. This non-confirmation is typical at turns. Back to 98.27 or so wouldn’t be a surprise. Finally, consider the extreme short term sentiment readings (DSI readings from Monday) in front of FOMC on Wednesday. The narrative heading into FOMC is that there is no limit to the Fed’s balance sheet. What else can they say that would ‘surprise’ markets in that direction? Risk for tomorrow seems like a classic ‘sell the news’ event.
June 2, 2020

The US dollar index closed lower for a fifth consecutive day on Monday as hopes of a faster than expected global economic recovery from the COVID-19 pandemic took hold. Markets remained steady despite widespread civil unrest in the United States due to the death of George Floyd and ongoing US/China trade tensions.