Education
November 19, 2020

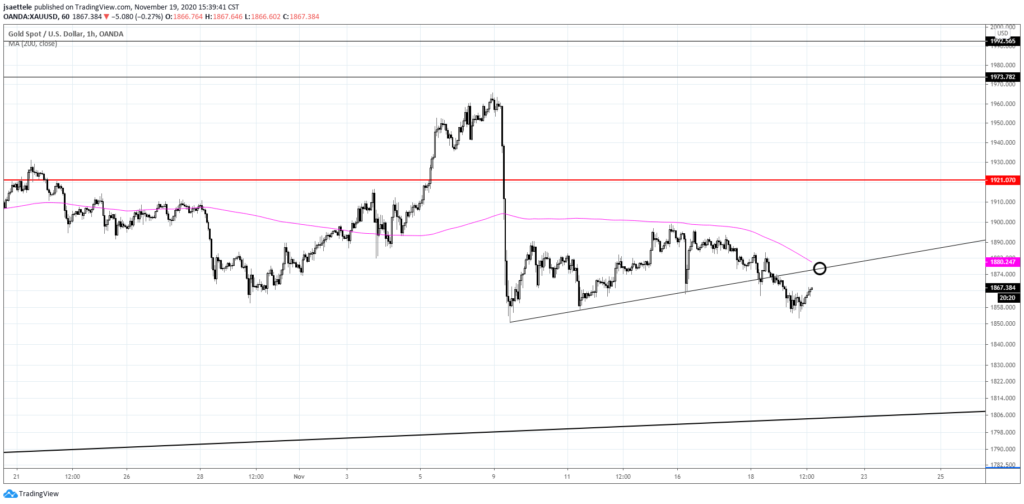
Assets prices were down in early U.S. trading as the USD rallied but everything reversed course when the magical U.S. session got underway (stocks up, metals up, USD down, etc.). I still like gold lower but a bit more strength may be in order to test resistance near 1876.
November 18, 2020

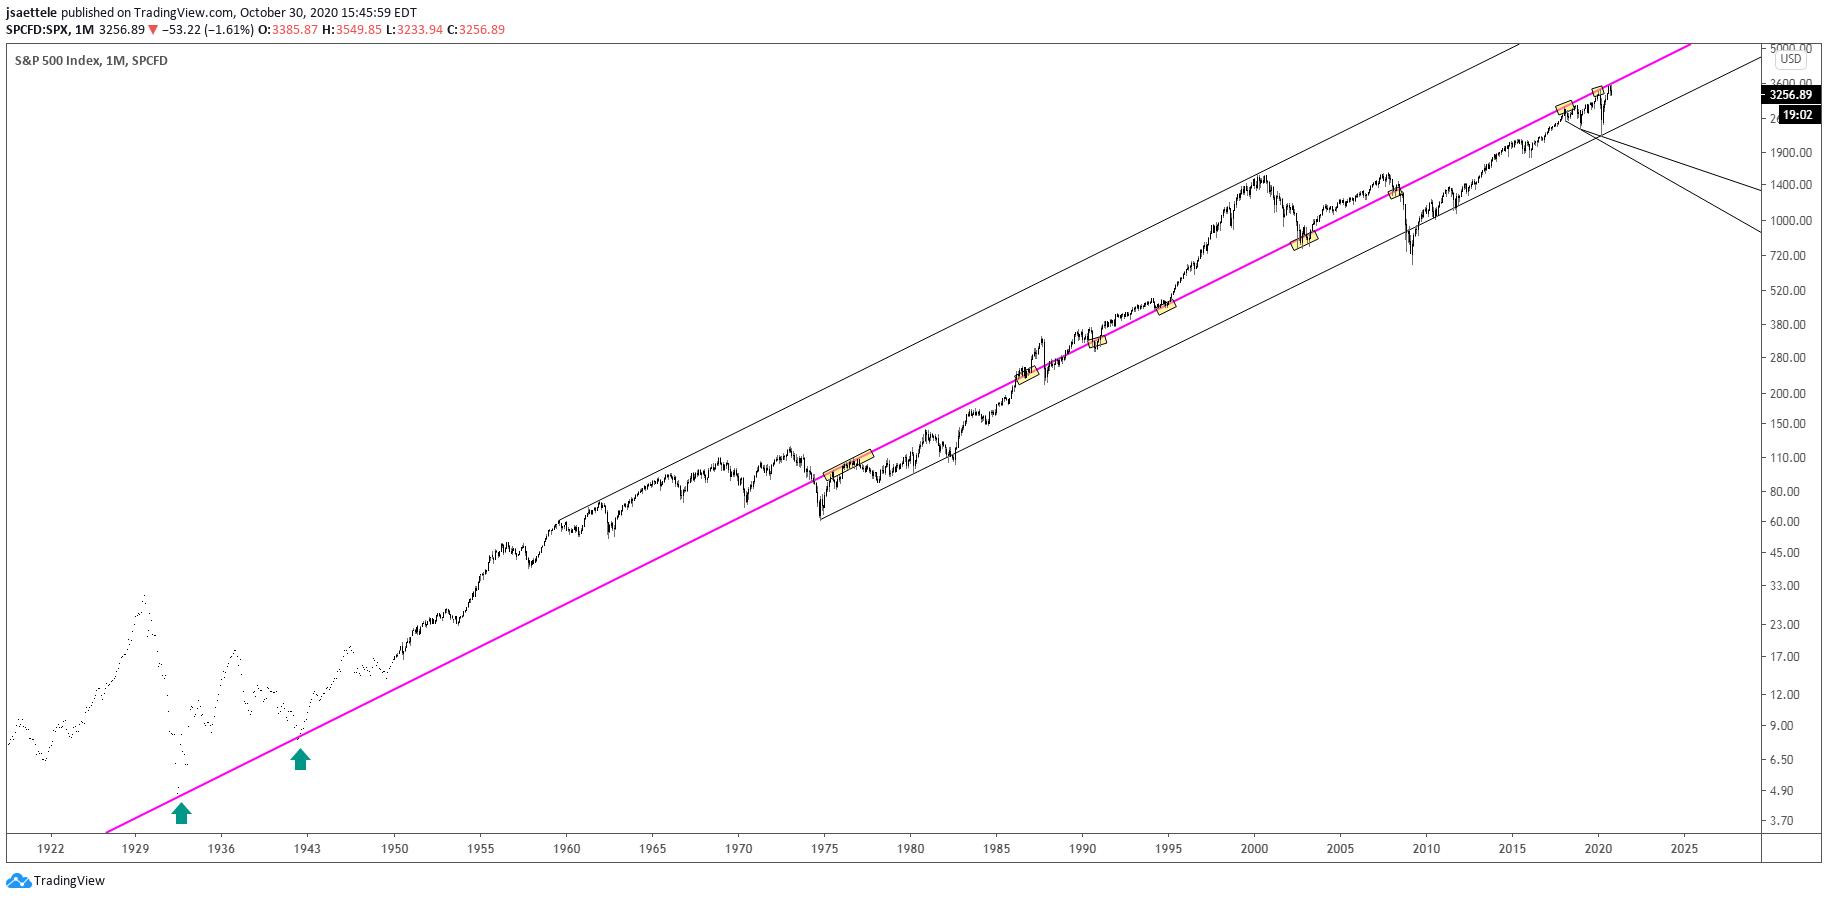
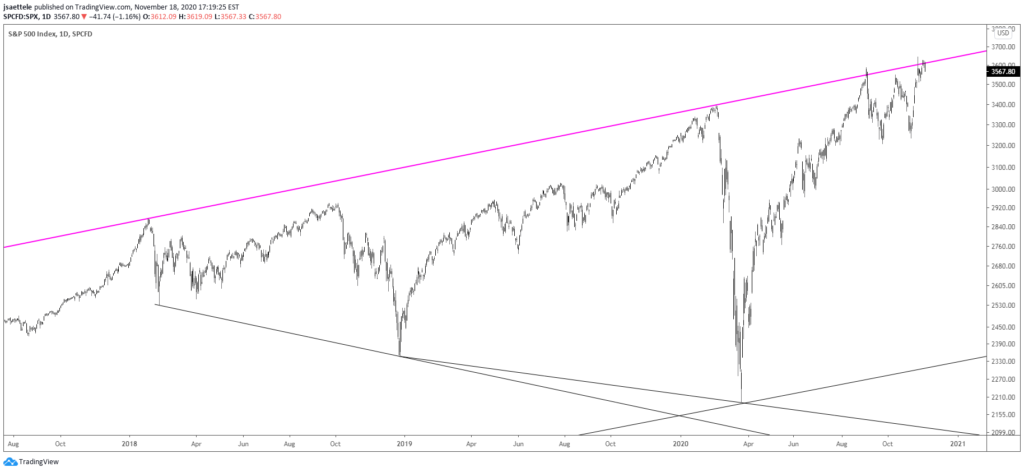
Neither SPX or the Nasdaq have broken above their reversal day highs from last week (11/9). What’s more, SPX has reversed yet again from the line that connects highs since 2018. Don’t forget that this line crosses major pivots for the last 88 years (monthly chart is below). U.S. equity valuation is at a peak as well (see 2 charts down).
November 17, 2020

Bitcoin! Heads up because ‘digital gold’ is quickly approaching its all time high of 19666. Just under this level is a parallel that crosses major levels (mostly from 2015 to 2017). BTCUSD is a long term bull but I’m of the mind that we see a strong reaction from the parallel/all time high.
November 16, 2020

USDCNH made a weekly J Spike last week (price based only indicator). The platform that I use to run these studies only includes USDCNH data since 2013 and this is the first bullish signal. There have been several bearish signals; at the 2018 and 2019 highs. A turn higher in USDCNH ‘fits’ with a turn lower in Chinese equities.
November 12, 2020

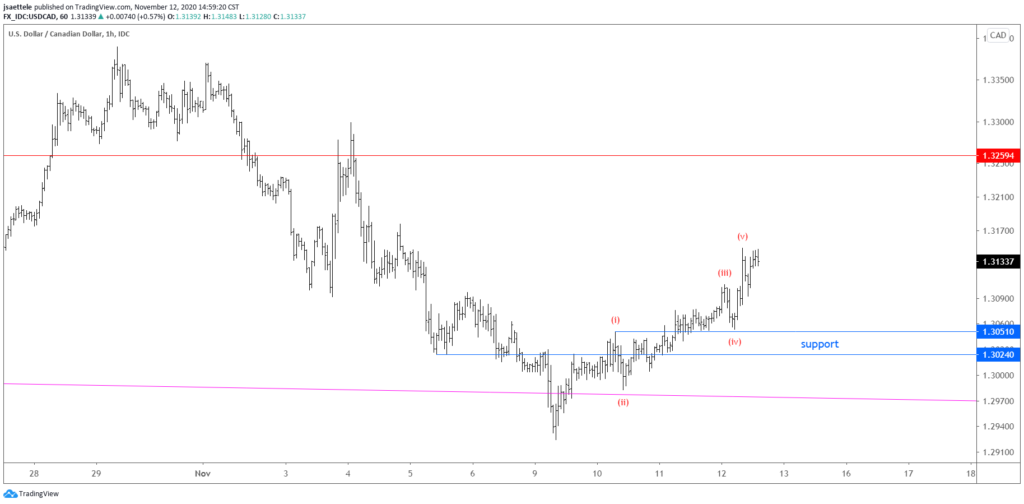
It was relatively quiet today but bullish evidence continues to mount for the USD. USDCAD, for example, followed through on its reversal from a 13 month low. The rally is impulsive (5 waves), which suggests that an weakness should prove corrective and give way to additional strength. Proposed support is 1.3025/50.
November 11, 2020

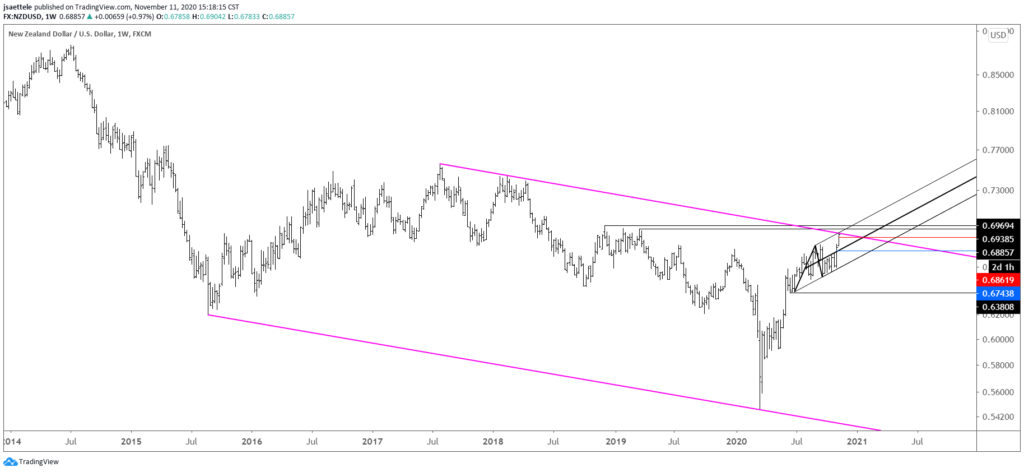
NZDUSD has ripped into the confluence of long term downward sloping channel resistance and short term upward sloping channel resistance. I’m interested in the short side IF we see some reversal evidence over the next 2 days (rest of the week). A drop below the high volume level from RBNZ at .6862 would be an early sign of a reversal.
November 10, 2020

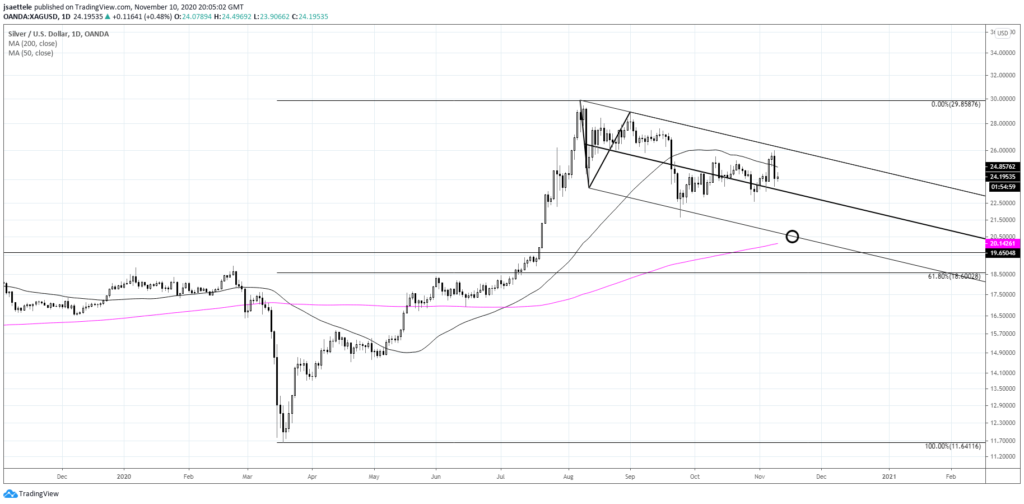
Silver has been trending lower since August 6th and put in a large bearish outside day on Monday. Focus is towards the lower channel line near 20.65, which is currently just above the 200 day average. Resistance should be about 24.56 (see 4 hour chart below). A downside bias is reinforced by the fact that VWAP from the high was resistance on SLV on Monday (see 2 charts down).
November 9, 2020
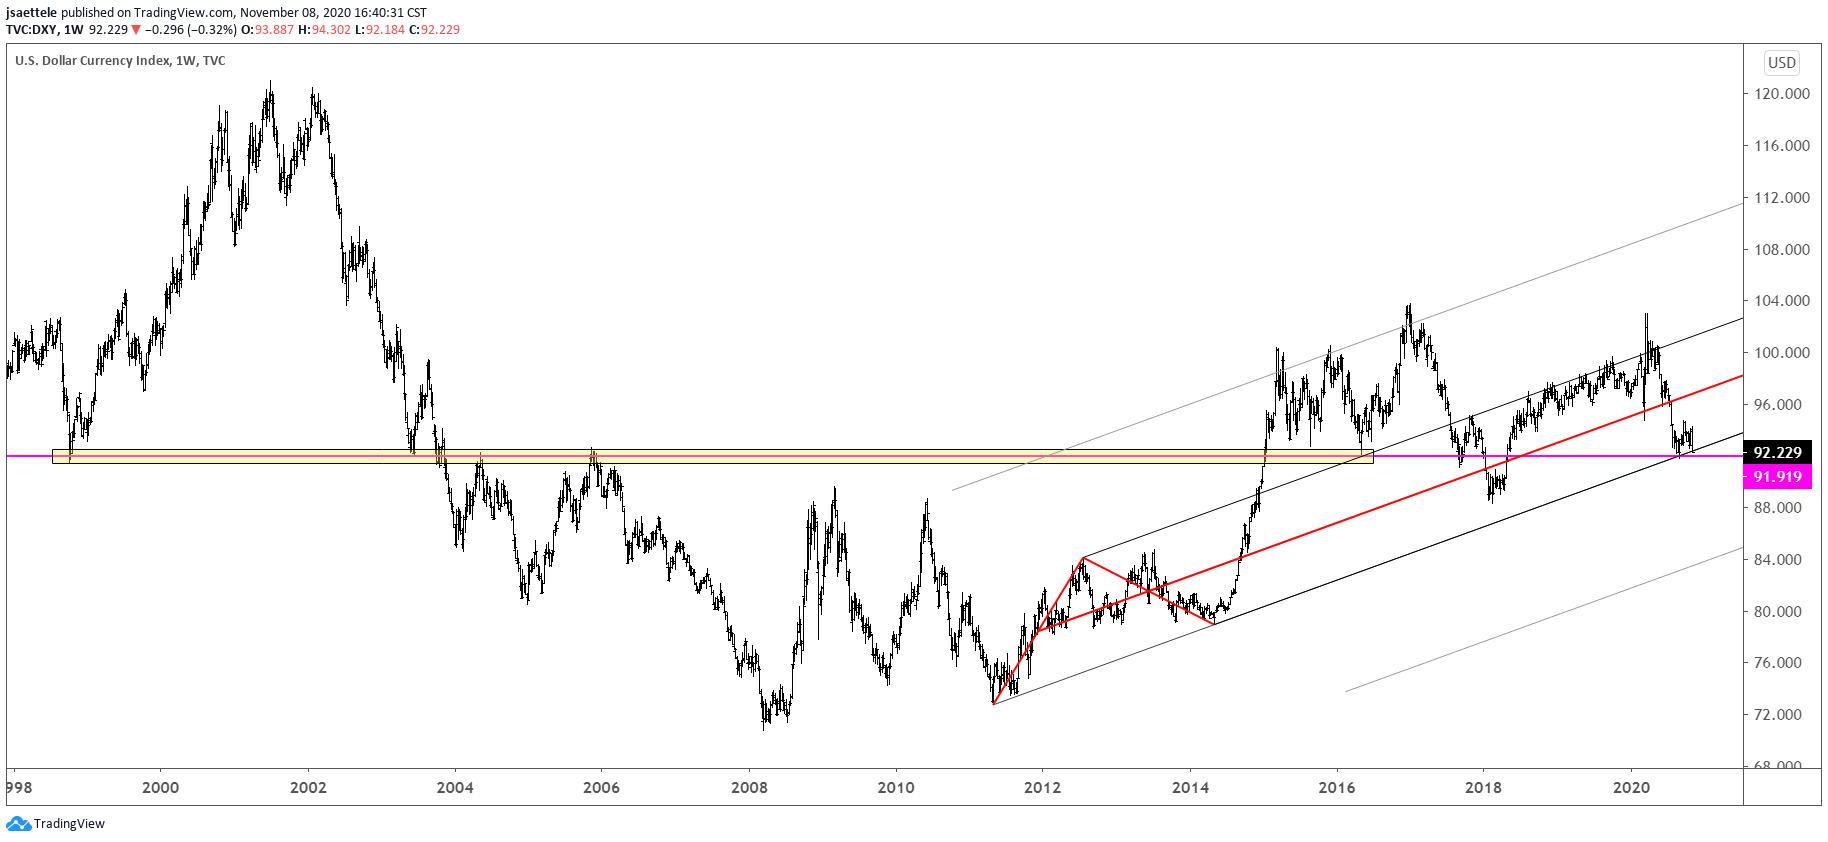
DXY continues to trade at/just above a major long term level. Nothing has changed. This is support until broken (daily closing basis at least). The UUP (see below) warns that last week’s drop is a trap. The red bars on the UUP chart show when price closed at a 52 week low with volume at least as high as it was last week (1.8 x the 13 week average). Every instance except one (highlighted in yellow) was a capitulation low. Stay tuned.
November 1, 2020
Another month is in the books and SPX continues to trade ‘heavily’ under the its ‘meridian line’. An inside month formed in October. Recall that September was an outside bearish month (see the close up view below). Of note is XHB (homebuilders), which made a monthly volume reversal in October (see below). Is this one of the last segments of the market to put in a top?