Education
December 13, 2020

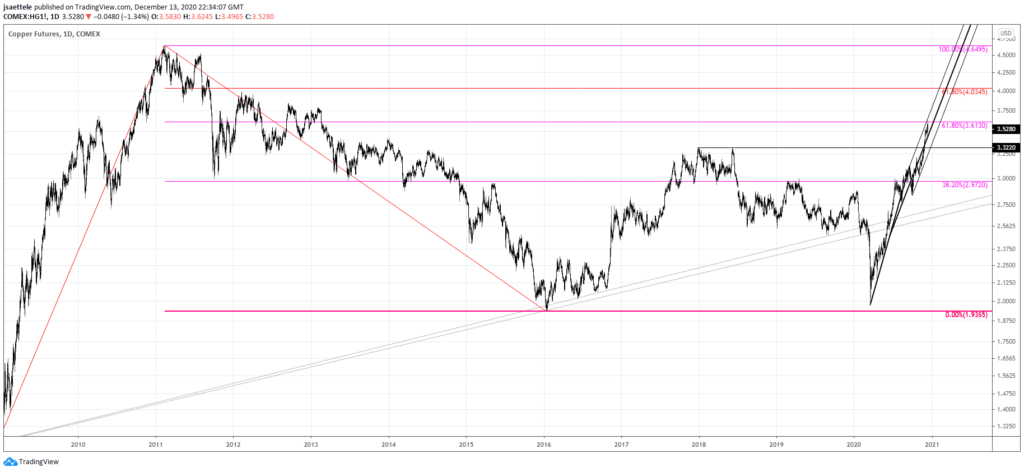
Copper reached the noted 61.8% retrace at 3.6130 on Friday and reversed lower. The level is also reinforced by the upper parallel of the channel from the March low. Let’s see how action develops following Friday’s reversal but this is a great spot for a more important pivot. I’m also wondering if copper is ‘the canary in the coal mine’ regarding other assets (USD, stocks, BTCUSD, etc.).
December 2, 2020

Copper is trading at its best level since March 2013 and has rallied 7 of the last 8 months. Be aware of the 61.8% retrace of the decline from the 2011 high at 3.6130 for possible resistance. Considering that ‘everything’ is going up against the USD, this level could prove important from a multi-asset perspective.
November 16, 2020

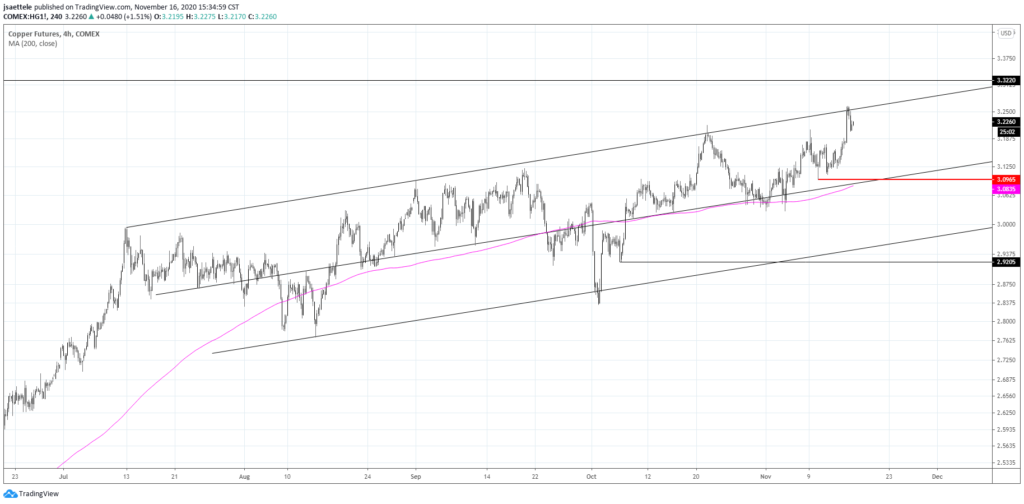
Copper is at new highs and again testing channel resistance. Be aware of the potential for failure up here again. If strength persists then know that the 2017 high is at 3.2220. A push above there would put copper at its highest level since 2014!
November 3, 2020
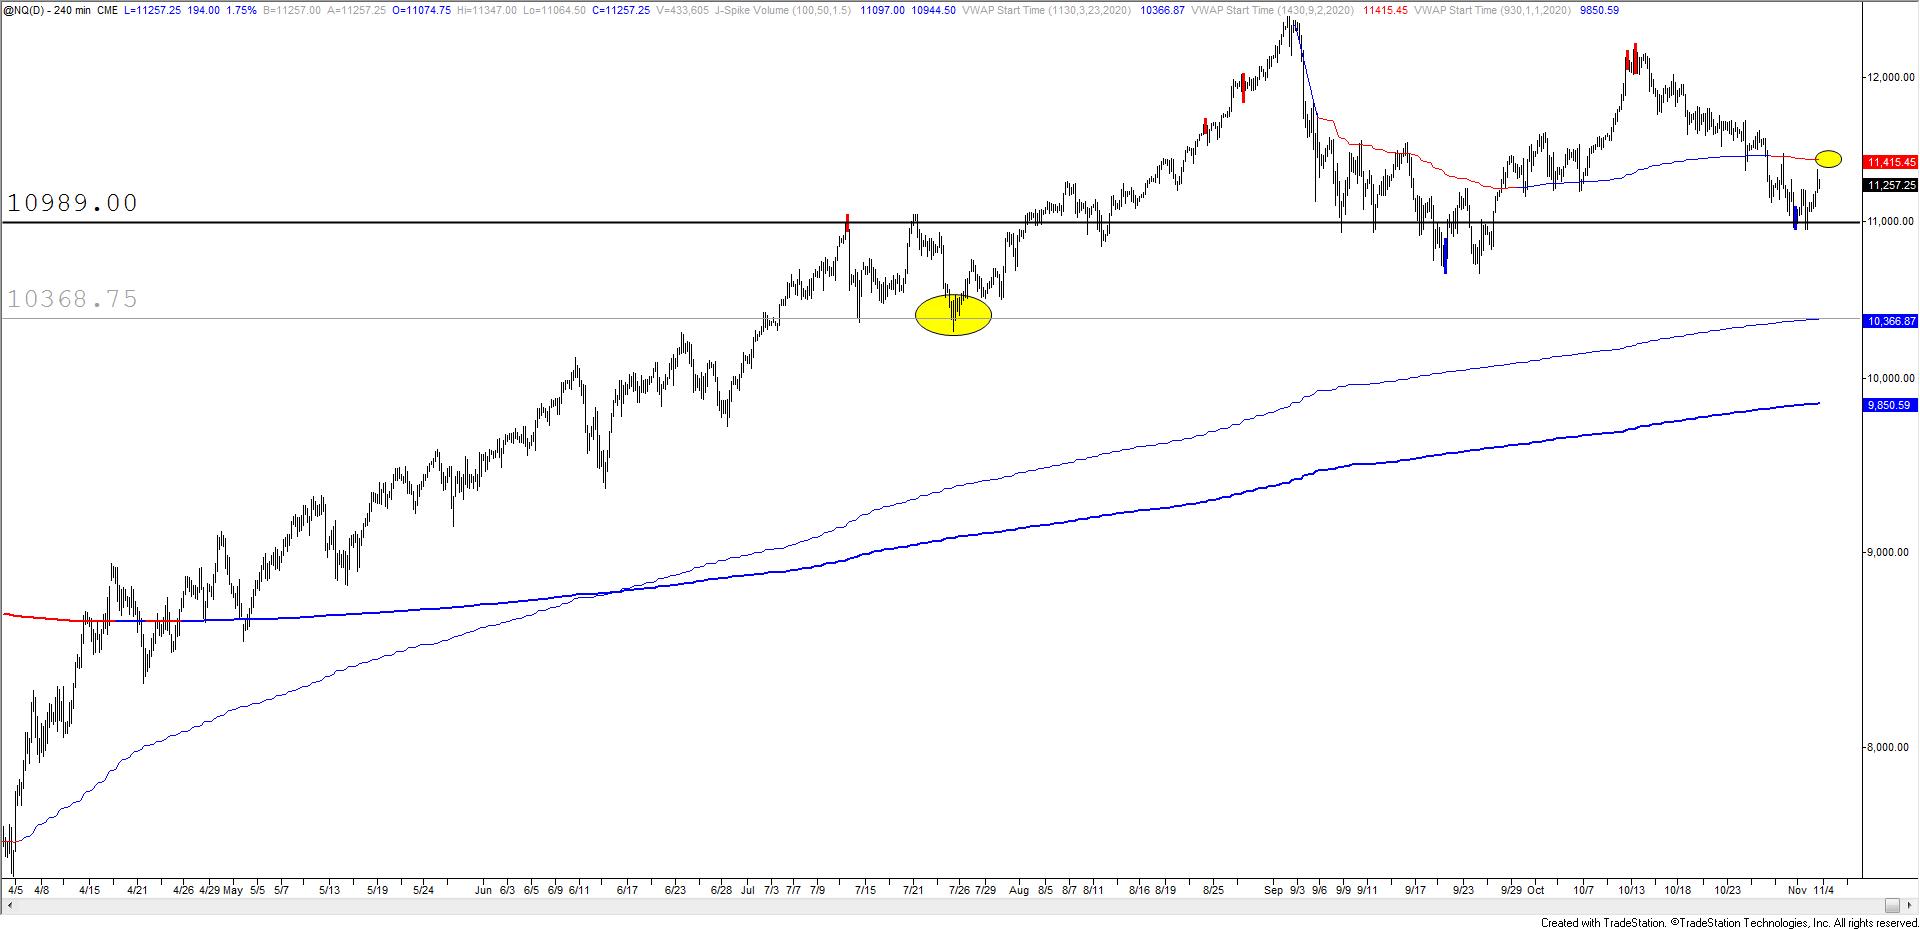
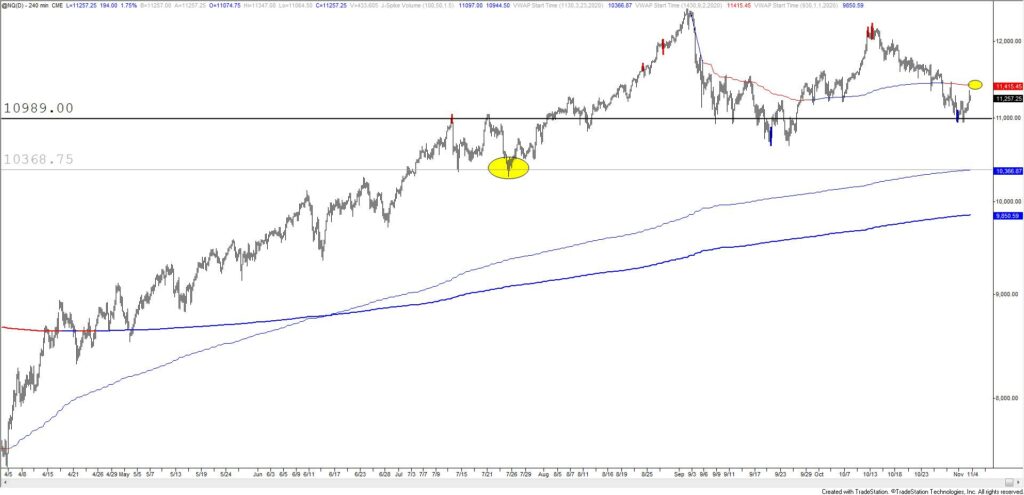
We got the bounce as suspected and Nasdaq futures are approaching proposed resistance near 11415. I’m on alert for a turn lower from that level.
October 26, 2020
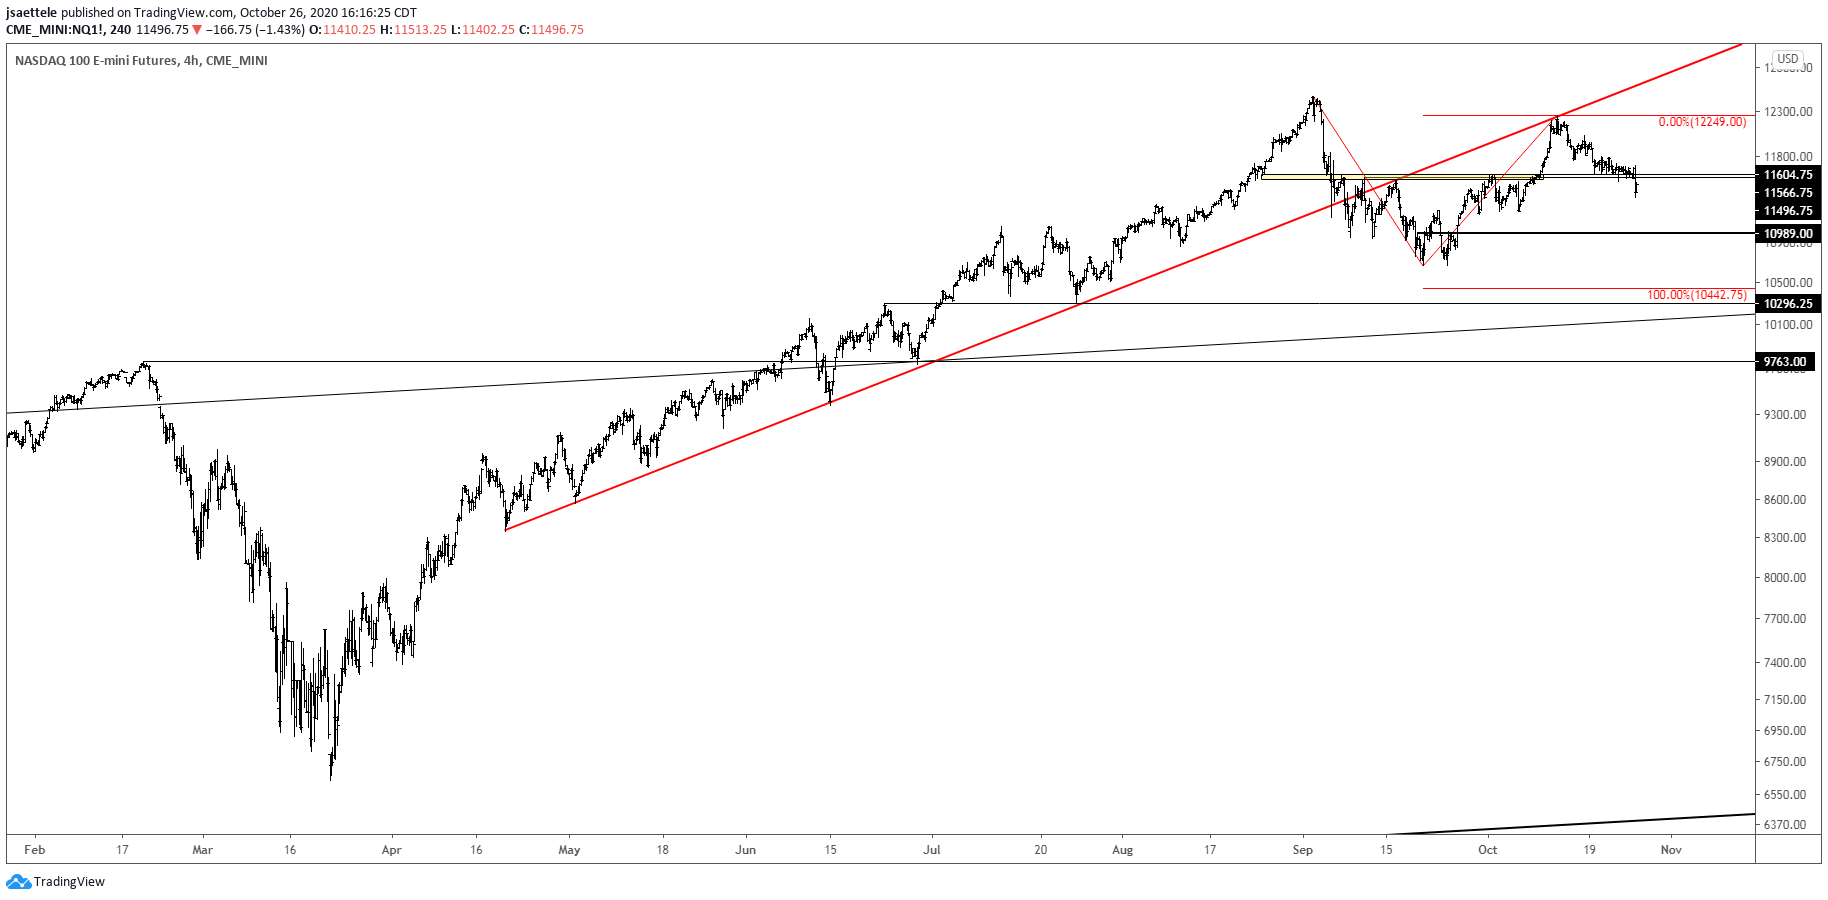
I’m treating the area around 11600 as near term bull/bear dividing line for Nasdaq futures. As long as price is below this level, I am looking lower. 10989 is a level to be aware of within the range with broader focus on 10300-10442. This is the 7/24 low and 2 equal legs down from the September high.
September 30, 2020

Gold traded into proposed resistance at 1908 today and immediately pulled back. I am of the view that price resumes lower from the current level towards the lower parallel near 1750. Failure to stay below today’s low would risk strength into the upper parallel of the bearish channel near 1940.
September 11, 2020
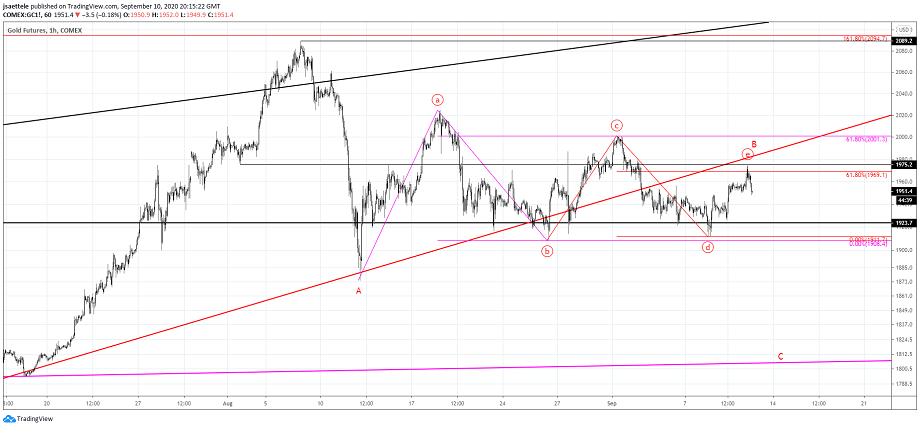
My working assumption is that a B wave triangle ended today at 1975.20 (exactly the 8/3 low) in gold. I am bearish against today’s high and looking for weakness lower in a C wave towards 1800 or so by the end of the month.
August 27, 2020
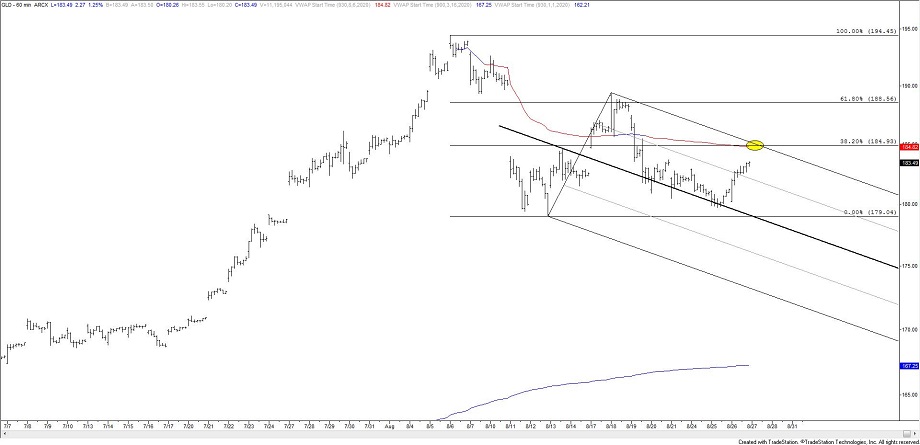
Since the 8/6 high in gold, I’ve been closely tracking GLD. The rally from 8/12 found resistance at the 61.8% retrace and a short term bearish channel is confirmed following the median line touch. If GLD has turned lower, then resistance should be 185.00 (38.2% retrace and VWAP from the high).
August 3, 2020
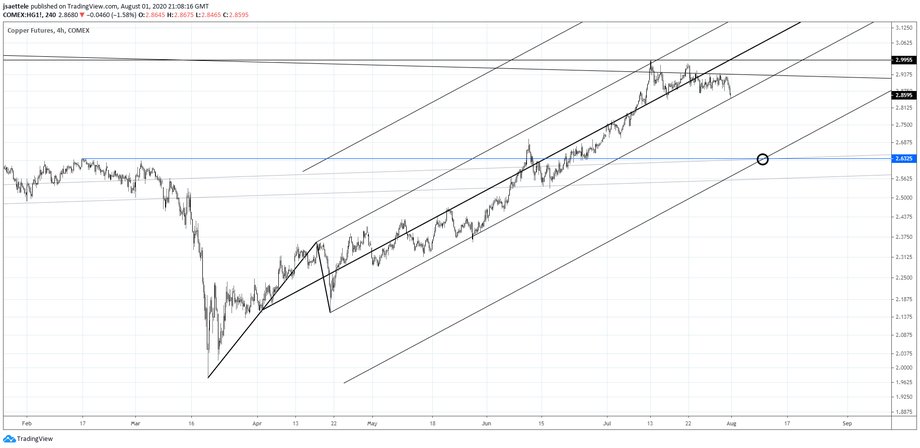
Copper begins the week at the lower parallel from the Schiff fork off of the March low…an important spot. If it breaks, then downside focus is 2.6325. Recall that copper put in a high 3 weeks ago at a major level (see weekly chart below).