Education
January 25, 2022
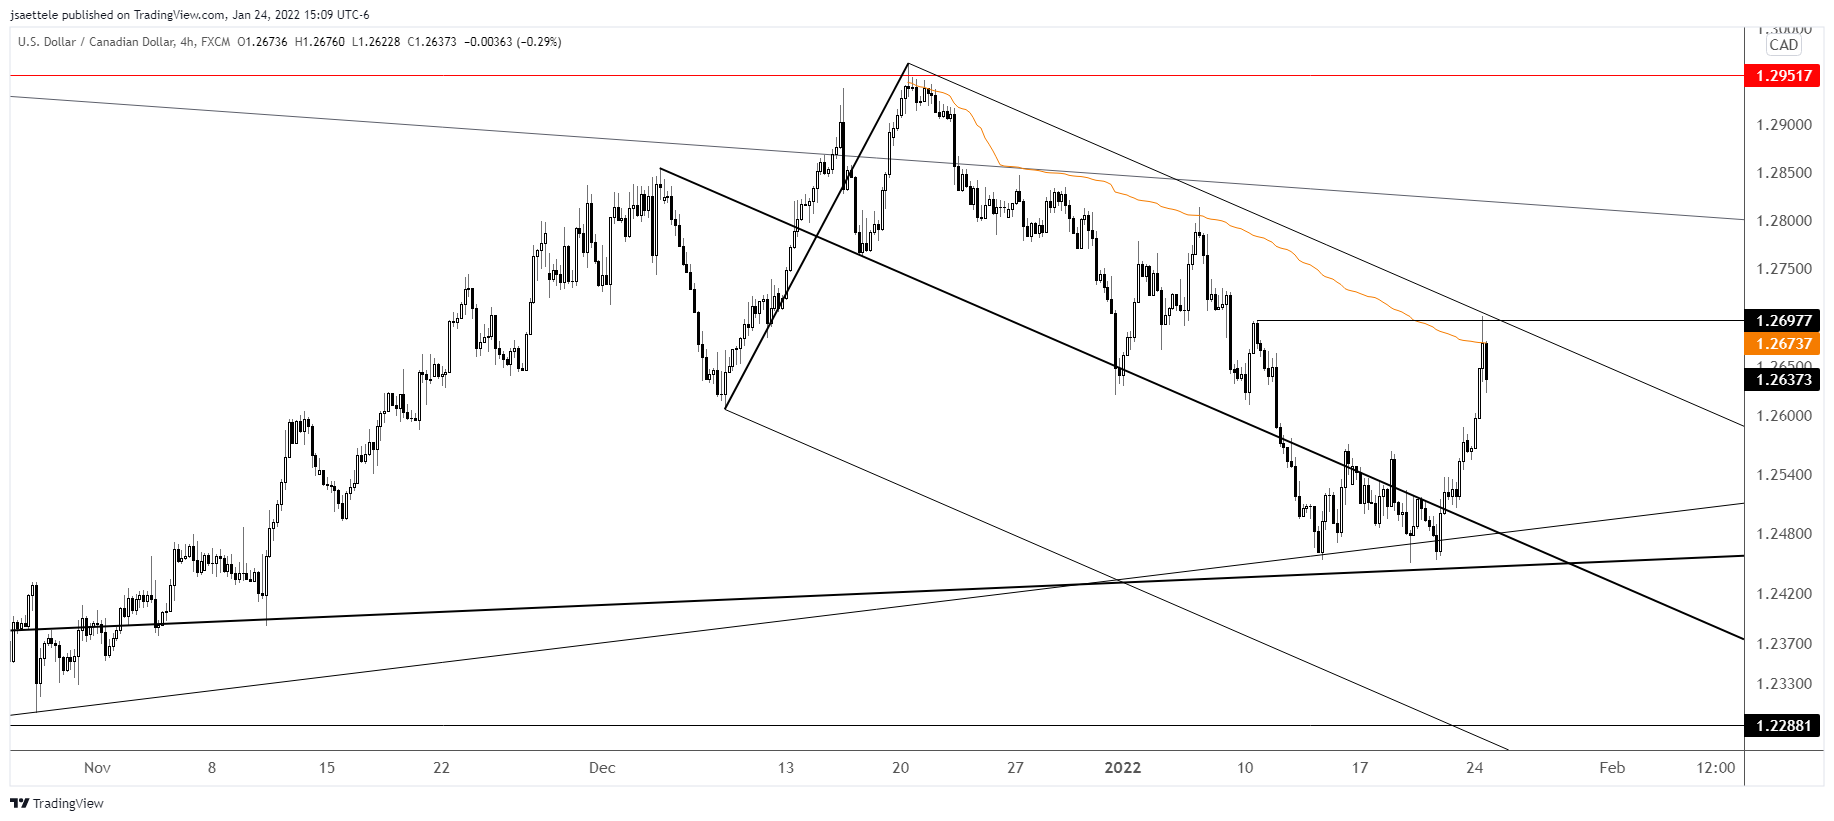
USDCAD ripped into the upper parallel of the multi month bearish fork today and turned lower. Resistance is also defined by VWAP from the high and the 50 day average. Given the level, I’m looking for USDCAD to trade lower.
January 6, 2022

ETHUSD has broken the line described yesterday (magenta line). This line is resistance if reached near 3640. Price is testing the 200 day average now (not shown) but the more important level is probably VWAP from the May 2021 high at 3050 (see below). Bigger picture, my view is that price drops to 985 or so in a 4th wave.
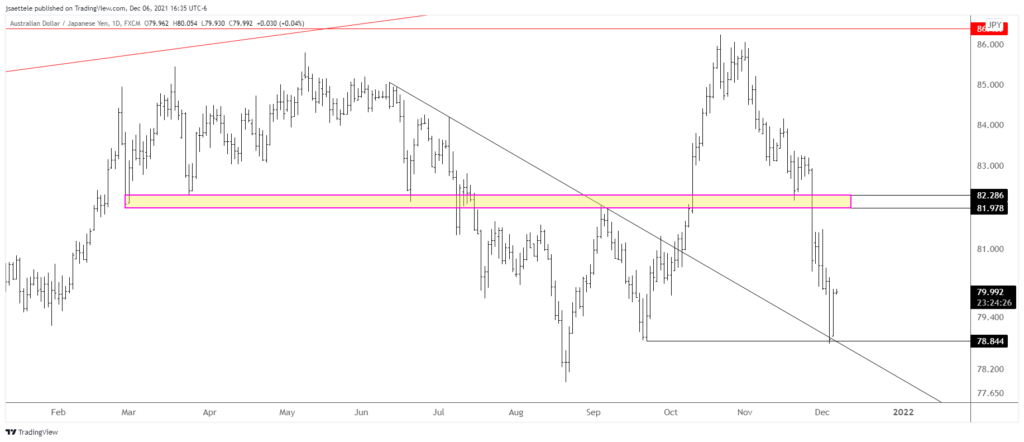
December 7, 2021

AUDJPY low on Friday was at the top side of former trendline resistance and the September low. This is a good spot for a bounce (this pertains to ‘risk’ in general). 82.00/30 is well-defined for resistance. Watch for support at 79.40/50.
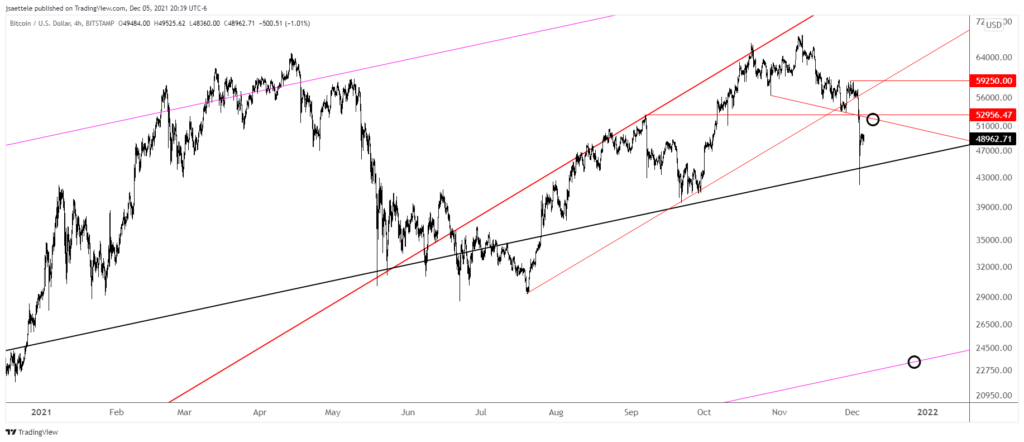
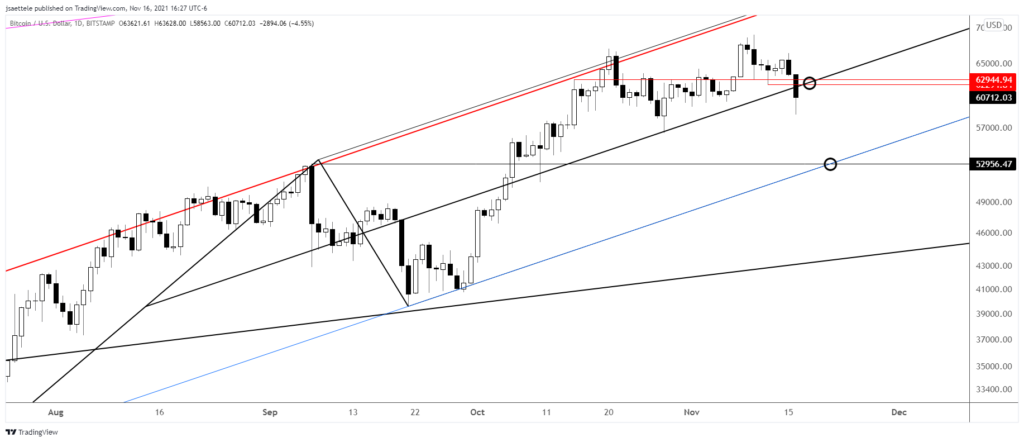
December 6, 2021

That 11/10 reversal nailed the high. From high to low, BTCUSD dropped 39%. The low over the weekend was at the center line from the channel that originates at the 2015 low. 53000 has been a key level since September and I’m watching for resistance at that level. With the low at the center line however, watch for support at 45000-46000. An aggressive bearish target on a break of the center line is 23000. The longer term picture is below.
November 17, 2021

BTCUSD has followed through on its 11/10 reversal. I love this setup. Price has broken the median line, which is now proposed resistance along with the 11/12 low at 62295. Initial downside focus is channel support (blue line) in the 52000s. A longer term view is below.
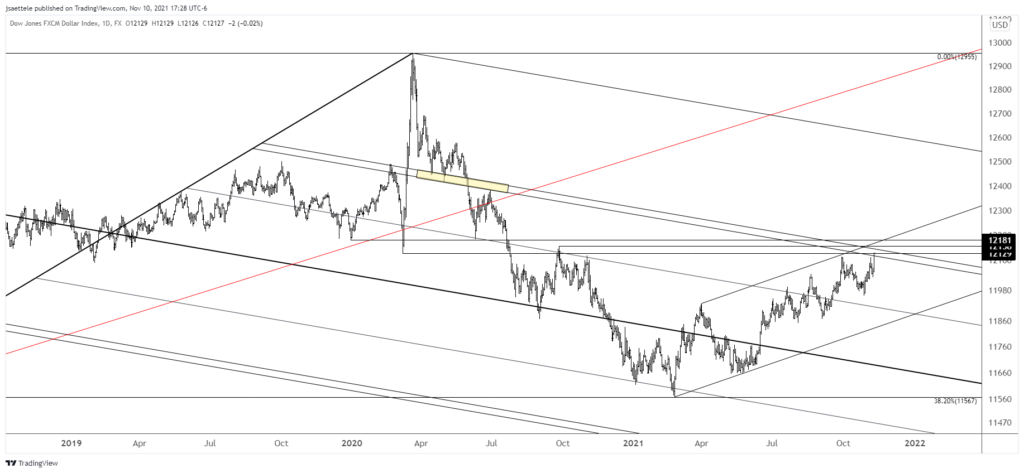
November 11, 2021
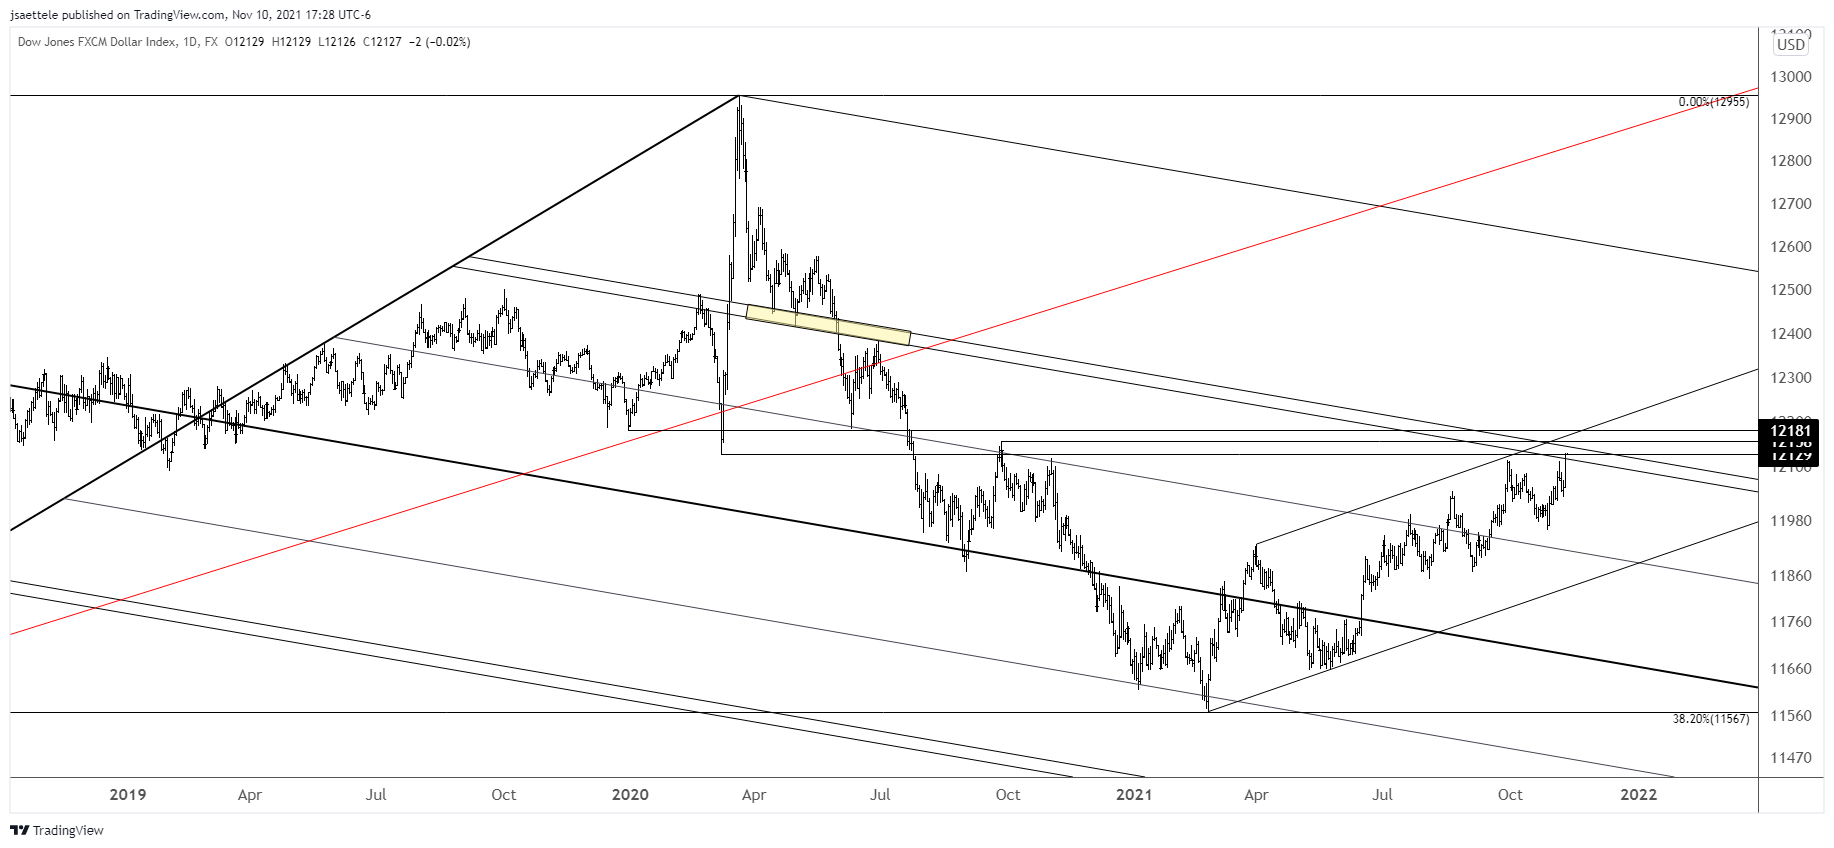
So much for all of that fancy Elliott mumbo jumbo. Remember the ‘5 waves down at multiple degree…blah blah blah’. USDOLLAR (quarter each of EUR, GBP, JPY, AUD) ripped to its highest level since September 2020 today. Sometimes various methods work and sometimes they don’t. The methods that I employ haven’t worked well for a few months now. This will change. It always does. Anyway, USDOLLAR is still in the vicinity of longer term resistance. The zone extends to 12181, which is the December 2019 low and parallel resistance.
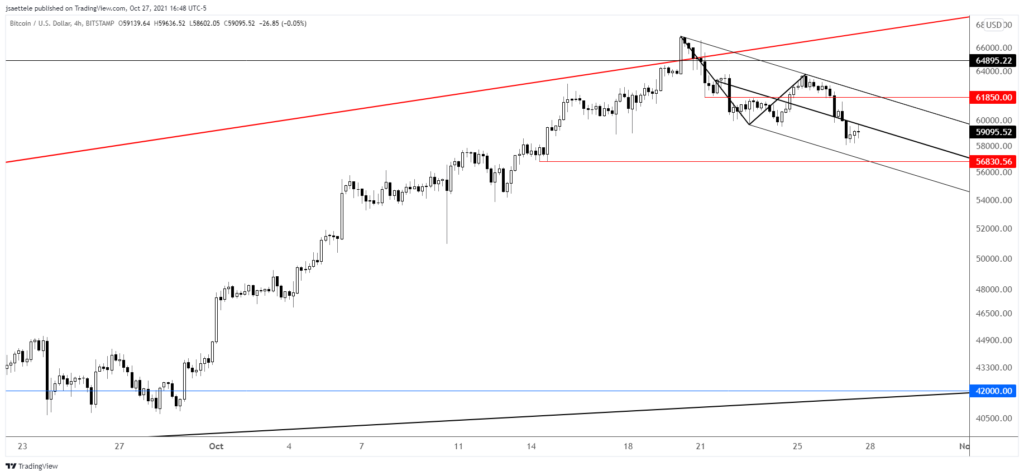
October 28, 2021

BTCUSD is off 13% since the top last week. If price drops under the short term lower channel line near 56830 then weakness will be considered impulsive and ‘waterfall’ weakness would be on the table. Watch for resistance near 61850. The weekly chart is shown below. This looks ‘toppy’ to me. Yes, ‘toppy’ is an official technical term. Former trendline support has provided resistance on the way up, a doji candle formed last week, and the rally failed after taking out the prior high. Seems bearish. Finally, is BTCUSD trying to tell equities something (see 2 charts down)
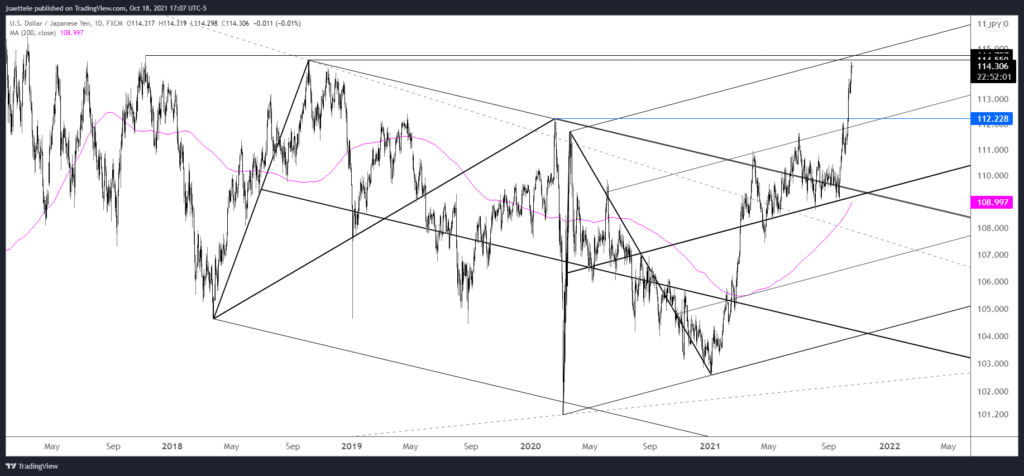
October 19, 2021

USDJPY has nearly reached the noted zone so pay attention. Aside from channel resistance, the level just above the market is defined by the late 2017 and 2018 highs at 114.55/74. A pullback from the zone would ‘make sense’. If reversal evidence arises, then there may be an opportunity to play the short side although 113.21 is in line for support (see below).
August 3, 2021

The most recent Economist cover highlights emerging market struggles. Again, check out the post in the link above for an explanation on why magazine covers are useful contrarian covers but the bottom line here is that EM (I’ll dig into EM equities and FX more in the coming days) is ‘sold out’.