Education
October 27, 2020
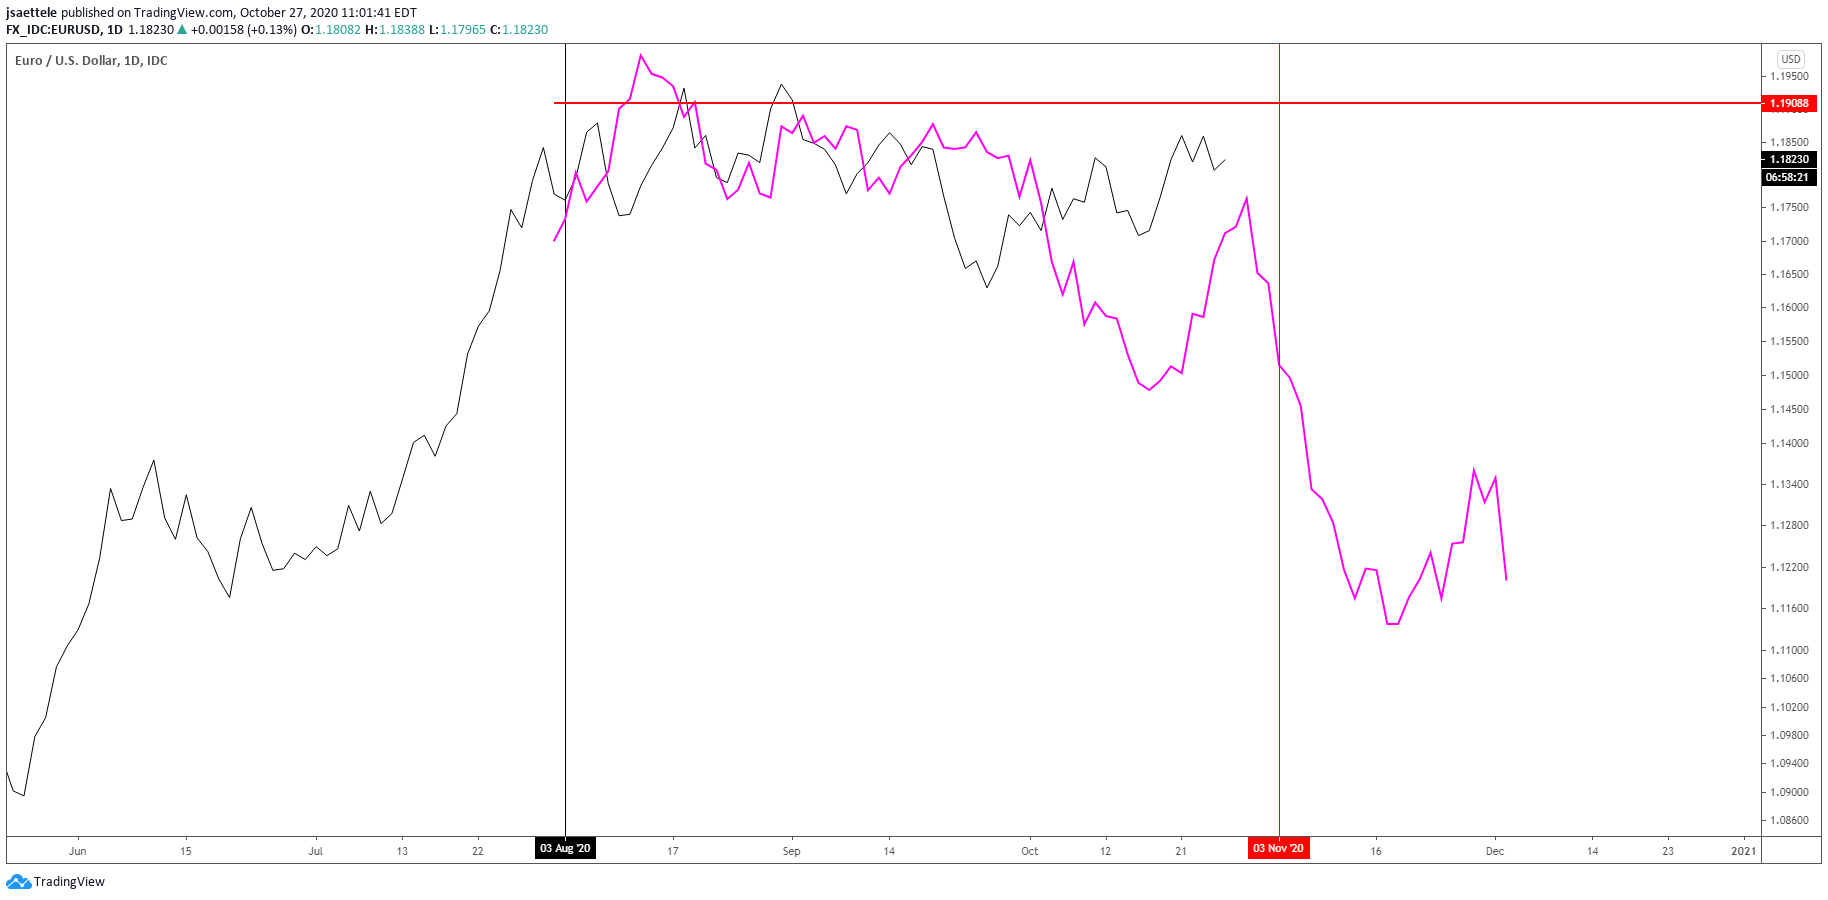
In case you haven’t heard, there are elections (president, congress, senate) in the U.S. next Tuesday, November 3rd. Do markets, notably the U.S. Dollar, tend to trade a certain way before and after U.S. presidential elections? In an attempt to answer this question, I plotted DXY in the 3 months leading up to and one month after every election since 1972 (blue for a Democratic win and Red for a Republican win). Each time series is compared to current DXY (in black). The vertical black line indicates election day. You’ll find these charts at the end of this report.
October 26, 2020
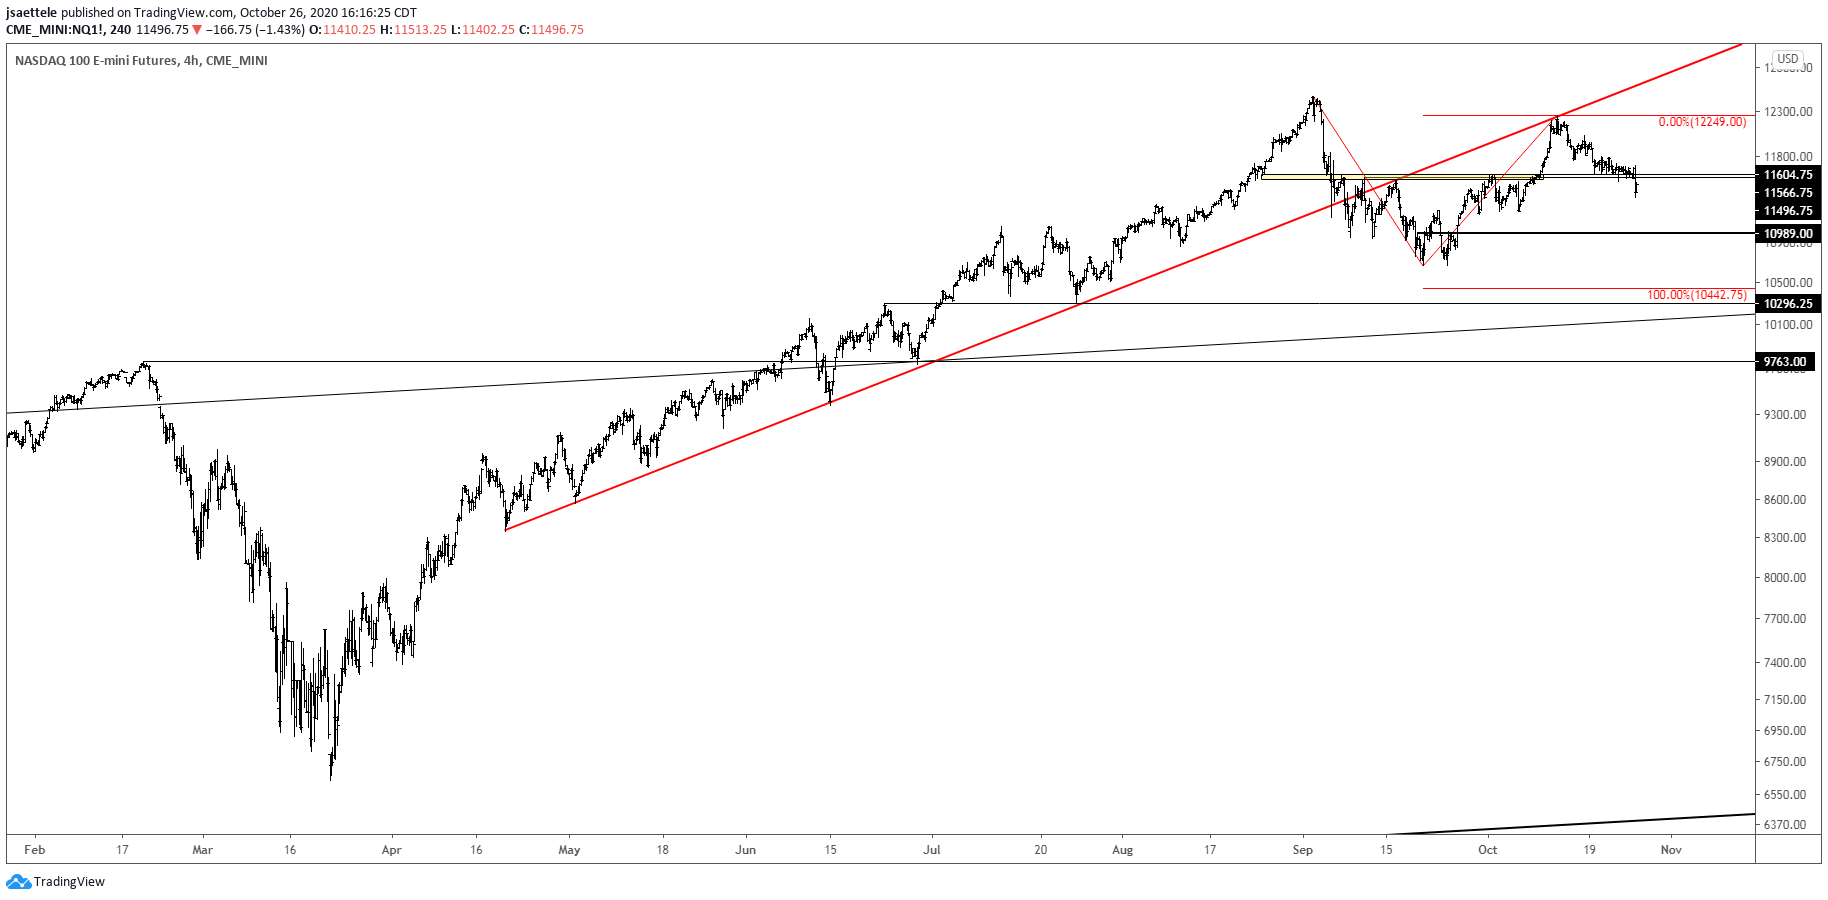
I’m treating the area around 11600 as near term bull/bear dividing line for Nasdaq futures. As long as price is below this level, I am looking lower. 10989 is a level to be aware of within the range with broader focus on 10300-10442. This is the 7/24 low and 2 equal legs down from the September high.
October 23, 2020

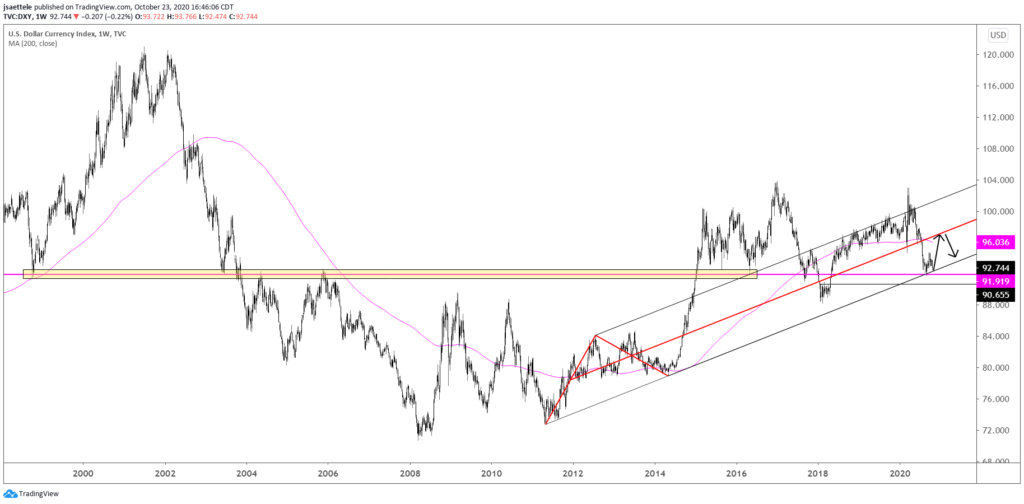
2011-2014 trendline support in DXY held in September. Focus is higher as long as price is above that level. 96-97 is a general zone to look towards. This zone includes the 200 week average and center line of the channel from the 2011 low.
October 21, 2020

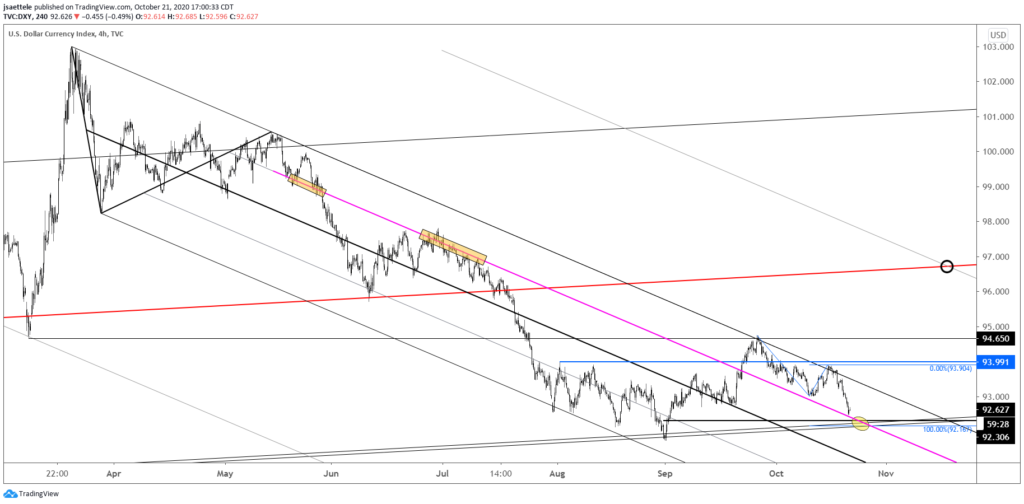
There is no change to DXY comments/opinion but I wanted to reproduce this chart because the index is nearing critical support at 92.17/30. The level is defined by long term trendline support (see longer term chart below), daily reversal support, and 2 legs down from the 9/25 high. This needs to hold if the range from late July is going to resolve to the upside.
October 19, 2020

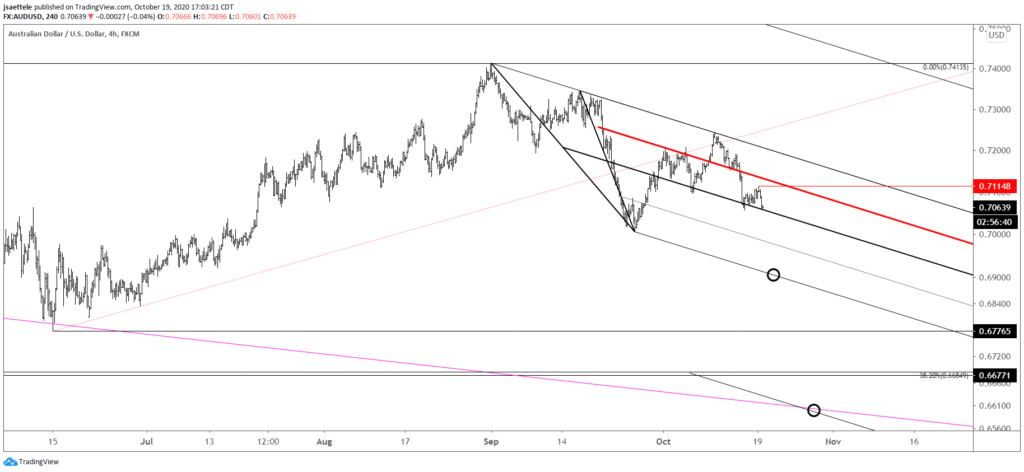
AUDUSD is pressing the center line channel center line again. The risk is for accelerated weakness following a break below the center line. Immediate focus would be the mentioned lower parallel near .6900. A break there opens up the channel extension, which intersects the top side of the trendline from the 2018 high near .6600. Resistance should be .7080s now.
10/15 – AUDUSD broke down and stabilized near the center line as suspected. Proposed resistance now is the 25 line, which has been resistance and support over the last few weeks. That is about .7135. Near term bearish focus is the lower parallel (extended off of the 9/25 low) near .6900.
October 16, 2020

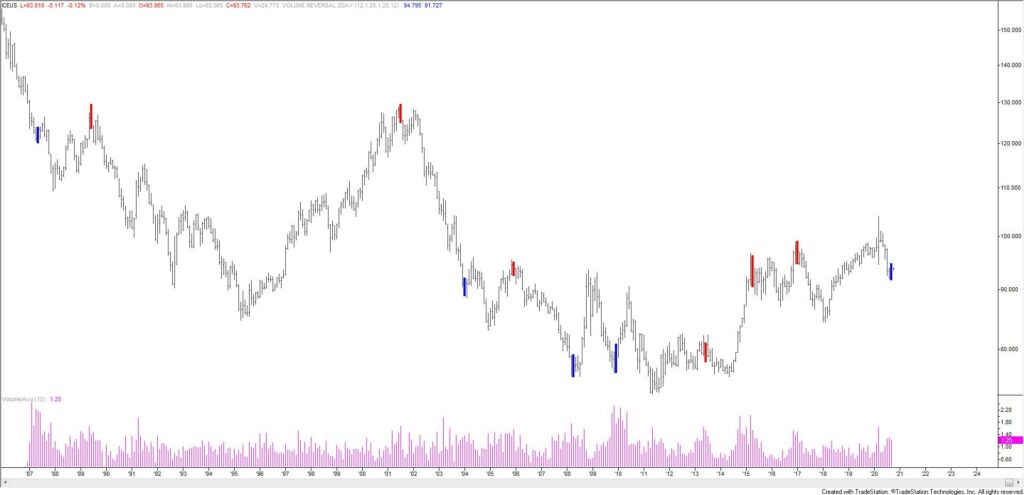
DX futures made a 2 bar monthly volume reversal in September. This means that August was a high volume up month and at least a 12 month closing high and September was a high volume down month. This is the first bullish signal since December 2010. UUP ( Dollar ETF) also made a monthly volume reversal. Price history begins in 2007 but this is the 4th bullish reversal since then. The prior 3 nailed major turns. The 2 bearish reversals also nailed turns.
October 15, 2020

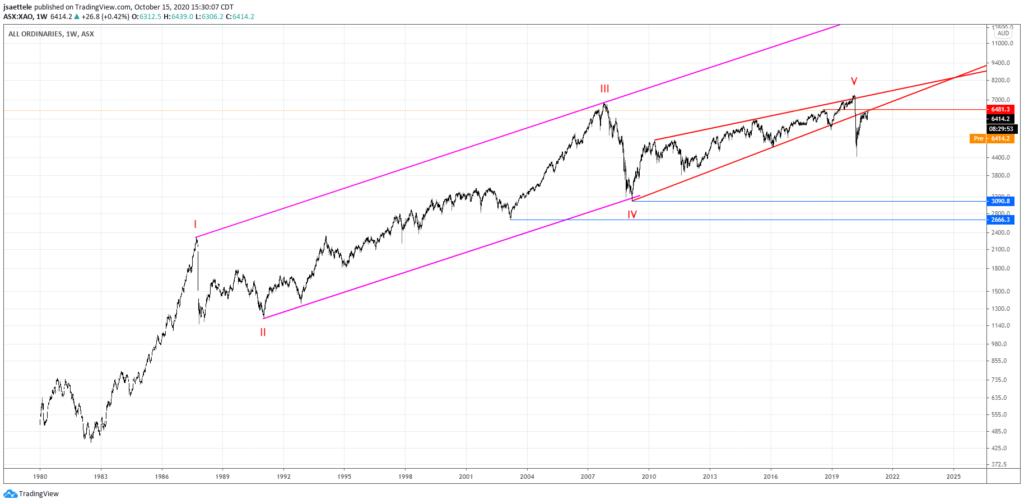
Australia’s All Ordinaries Index (local currency terms) is pressing against the underside of former trendline support. In fact, the rally from 2009 is an ending diagonal (wedge in classical charting) in the 5th wave position. Longer term, the entire rally from 1982 counts in 5 waves. The implication is that a long, drawn out corrective process is underway. Bottom line, the index is into well-defined resistance and I’m looking for price to roll over.
October 13, 2020

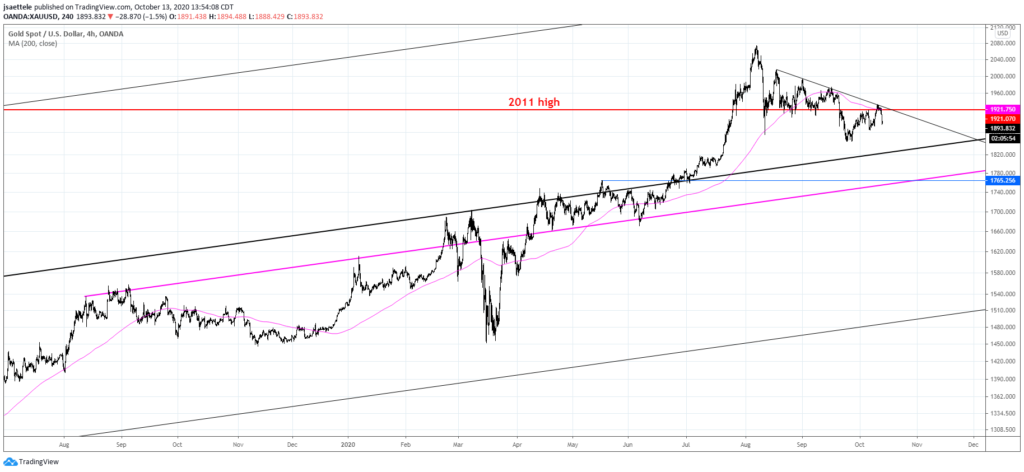
Gold has turned down from the 200 period average on the 4 hour chart, short term trendline, and 2011 high. Notice the action around the 2011 high over the last few months…gold remembers! Focus remains lower. 1760 appears critical for longer term support. This is the May high, near the 200 day average, and is a parallel that crosses highs and lows since August 2019.
October 6, 2020
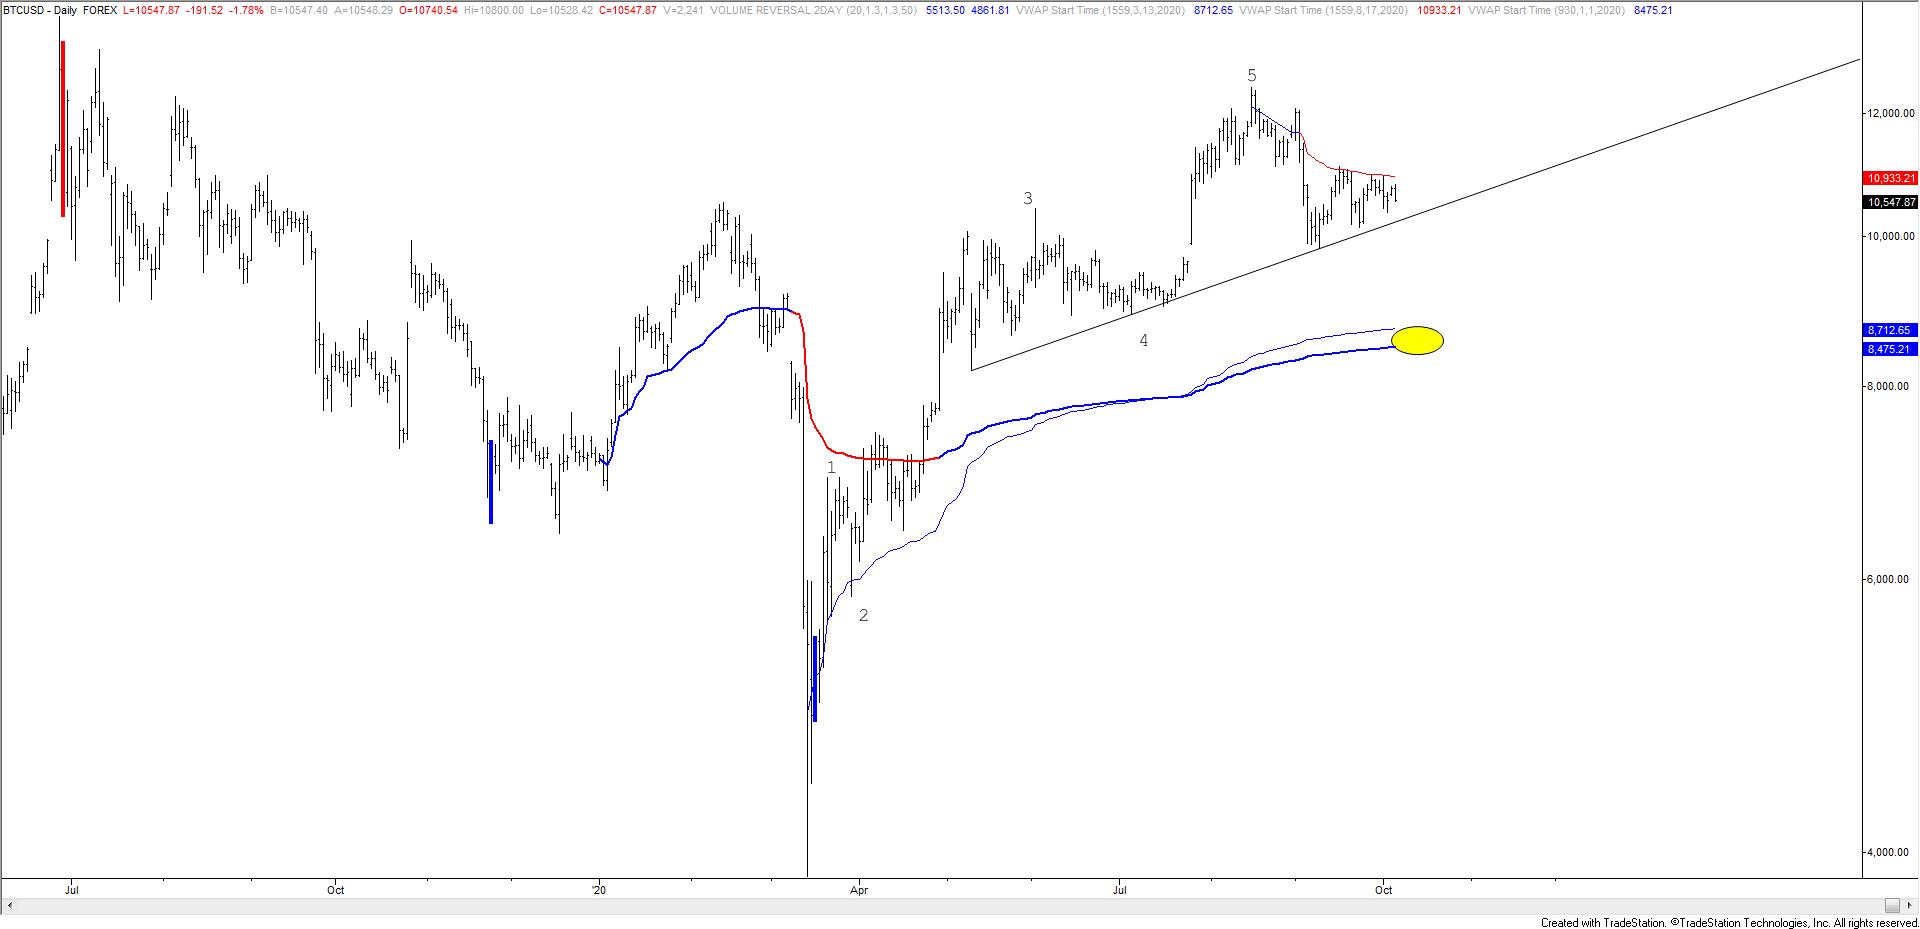
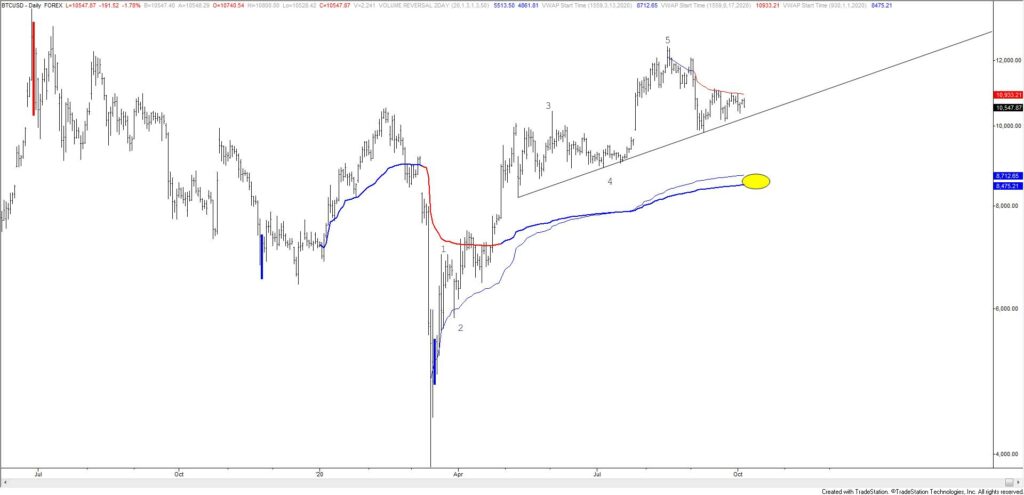
I’m leading with Bitcoin today but it could be more or less anything denominated in USD because it’s ALL THE SAME. Obsess over news if you must but there is one real reason for market moves since late March…the USD. USD up and everything else down. USD down and everything else up. The chart below illustrates this fact. Regarding BTCUSD specifically, VWAP from the high was resistance. A break under the trendline would open up VWAP from the low and 2020 VWAP in the mid-8000s. The Elliot pattern suggests that an important low could form in that vicinity because it’s also the area of the former 4th wave low.