Education
December 17, 2020

DXY nearly reached 90.02 today. Low was 90.13 and price reversed until FOMC, after which the buck was no longer allowed to rally. I maintain that reversal risk is high from this level (90.02). Note also the blue lines that connect lows since October 2019.
December 9, 2020

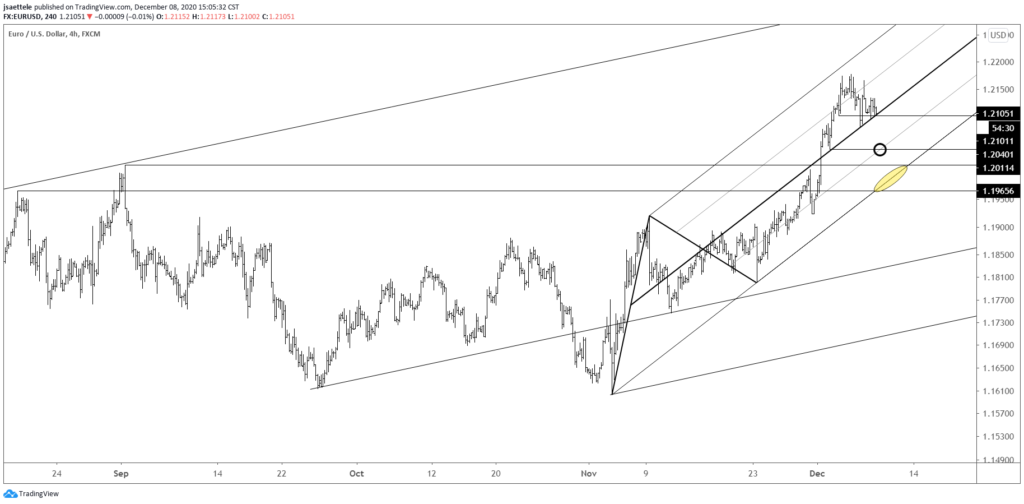
“Not a creature was stirring, not even a mouse.” That famous prose from The Night Before Christmas also applies to the FX market. EURUSD is likely waiting for ECB on Thursday so Wednesday might be another snoozer. In any case, price is sitting on the center line from the channel off of the November low. Price has bounced from this line the last two days so a break would indicate a near term behavior change. If that happens, then initial downside focus is 1.2040 and the lower parallel, which is about 1.1985 on Wednesday.
November 24, 2020
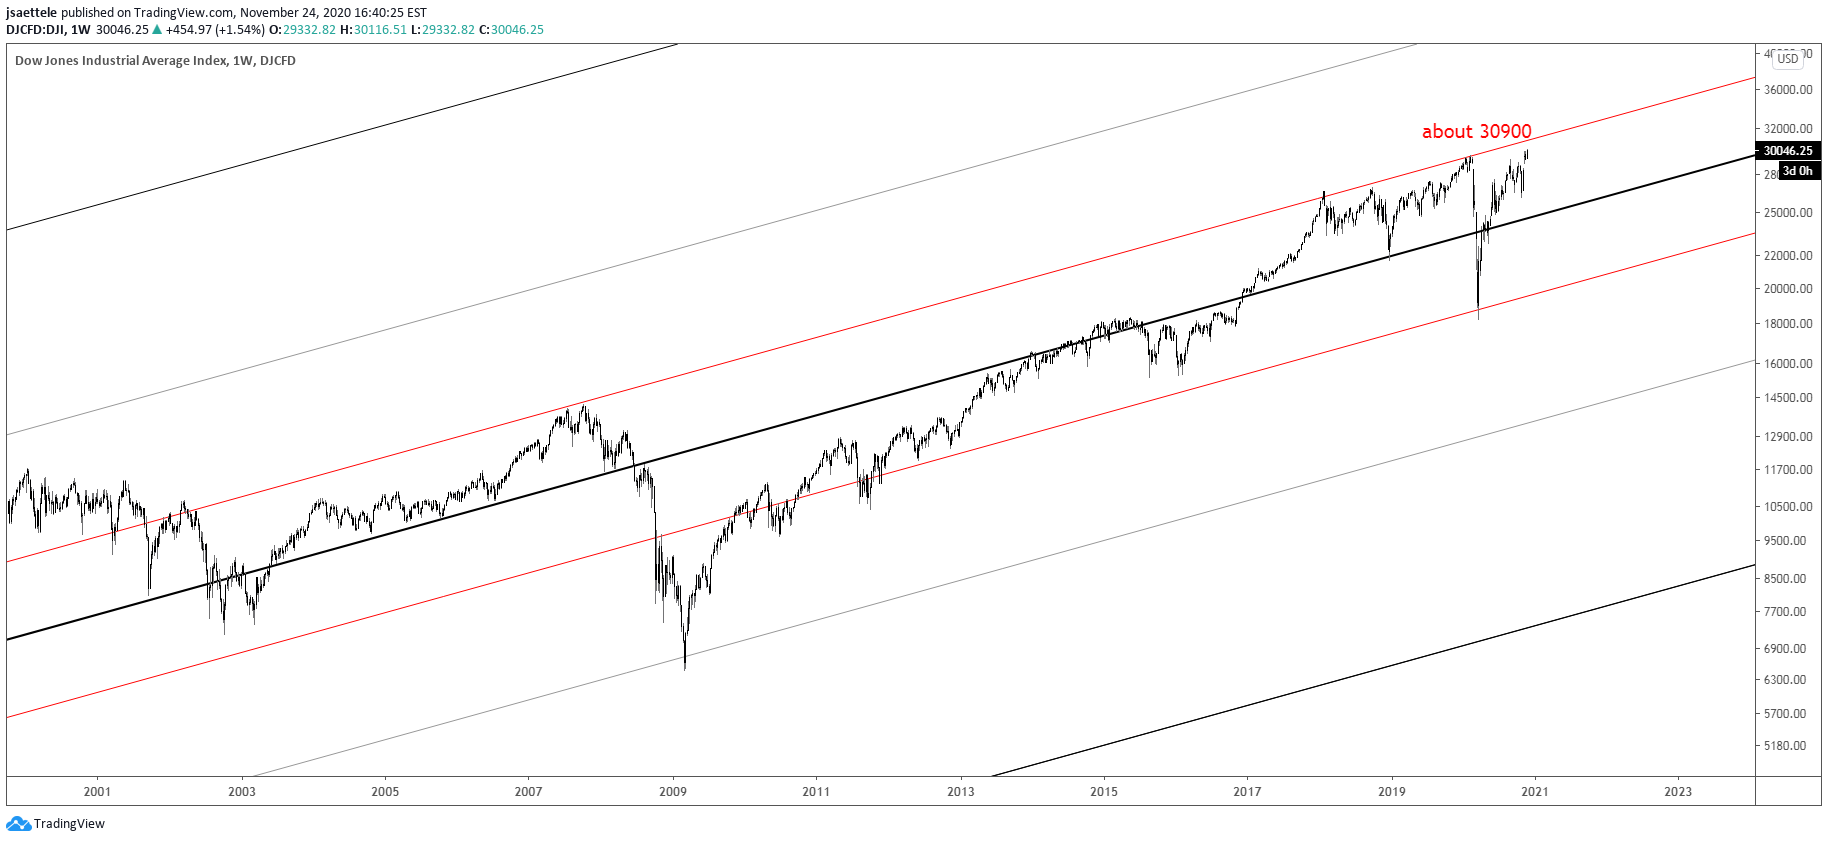
There is a massive parallel in the Dow at about 30900 that is worth noting. The line crosses the 2007 and 2018 highs and high from early this year. The line equidistant from the median line (concept symmetry) was support in March. These parallels are based on the line that connects the 1932 and 1982 lows (see monthly chart below).
November 9, 2020

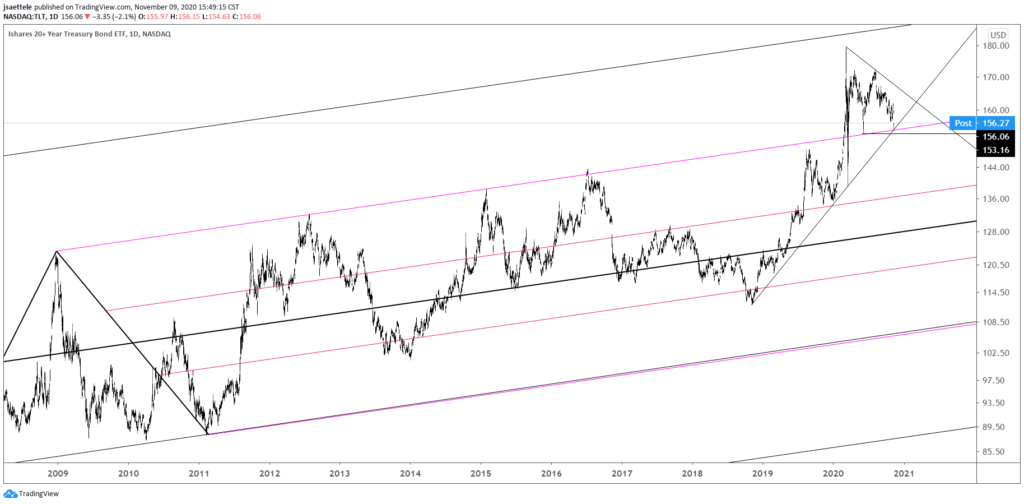
TLT has reached the long term parallel that was noted as the ‘critial level to pay attention to’ several weeks ago. Simply, this is a major decision point. Weakness below would be a game changer but support is support until broken so I’m thinking bounce.
November 9, 2020
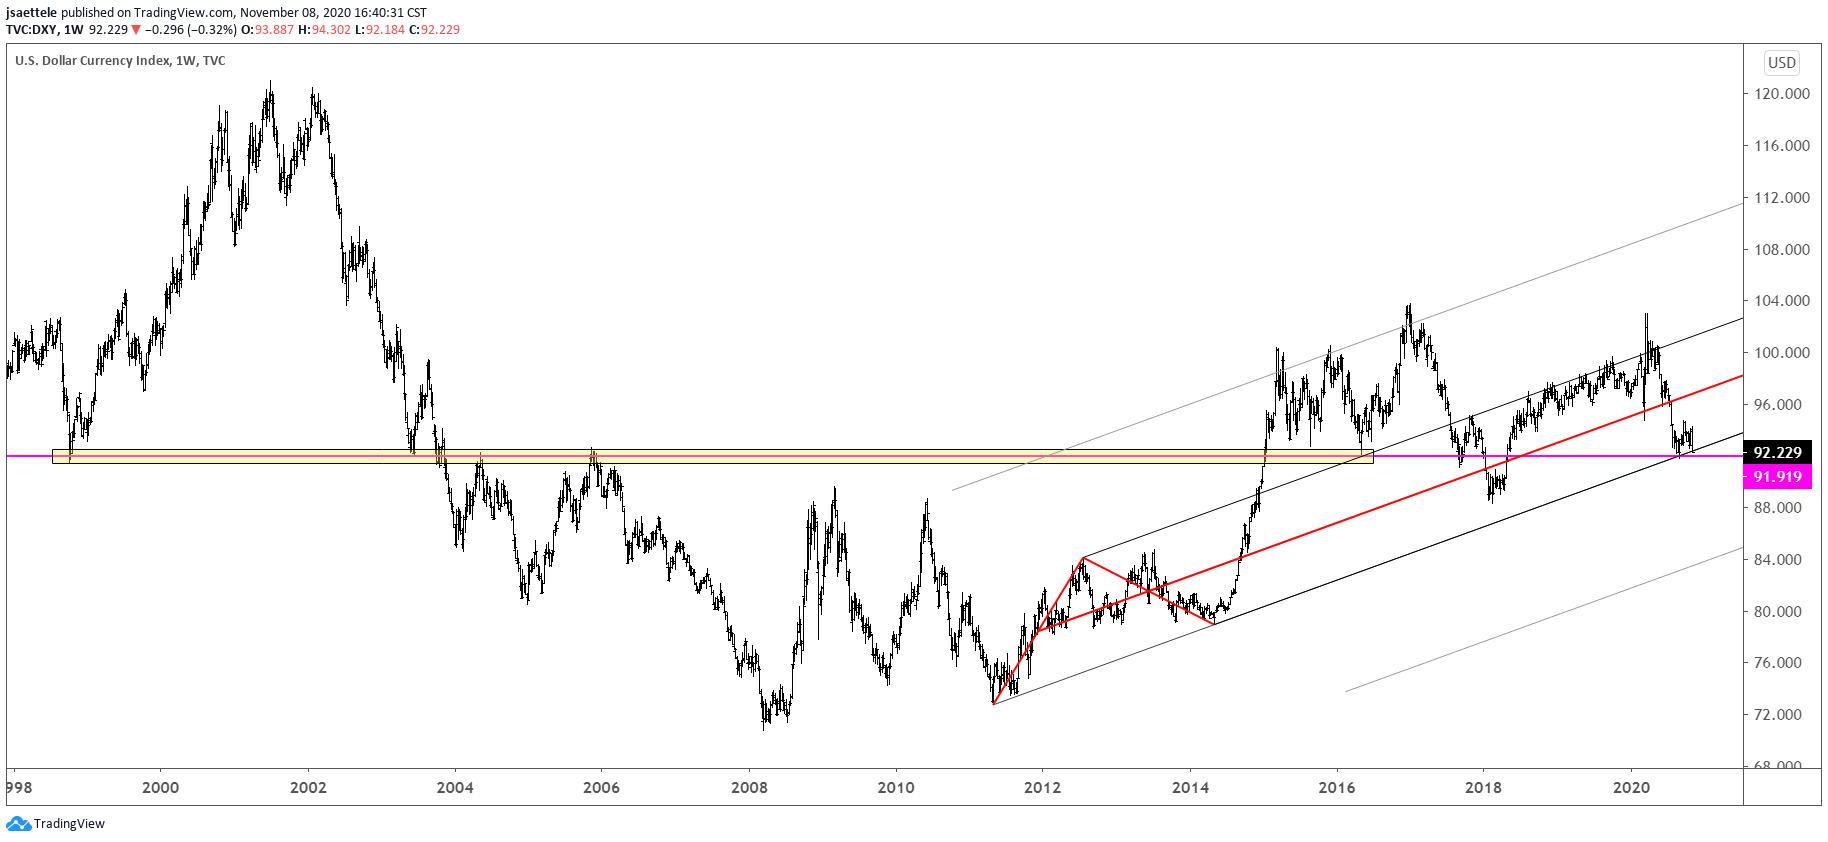
DXY continues to trade at/just above a major long term level. Nothing has changed. This is support until broken (daily closing basis at least). The UUP (see below) warns that last week’s drop is a trap. The red bars on the UUP chart show when price closed at a 52 week low with volume at least as high as it was last week (1.8 x the 13 week average). Every instance except one (highlighted in yellow) was a capitulation low. Stay tuned.
November 3, 2020
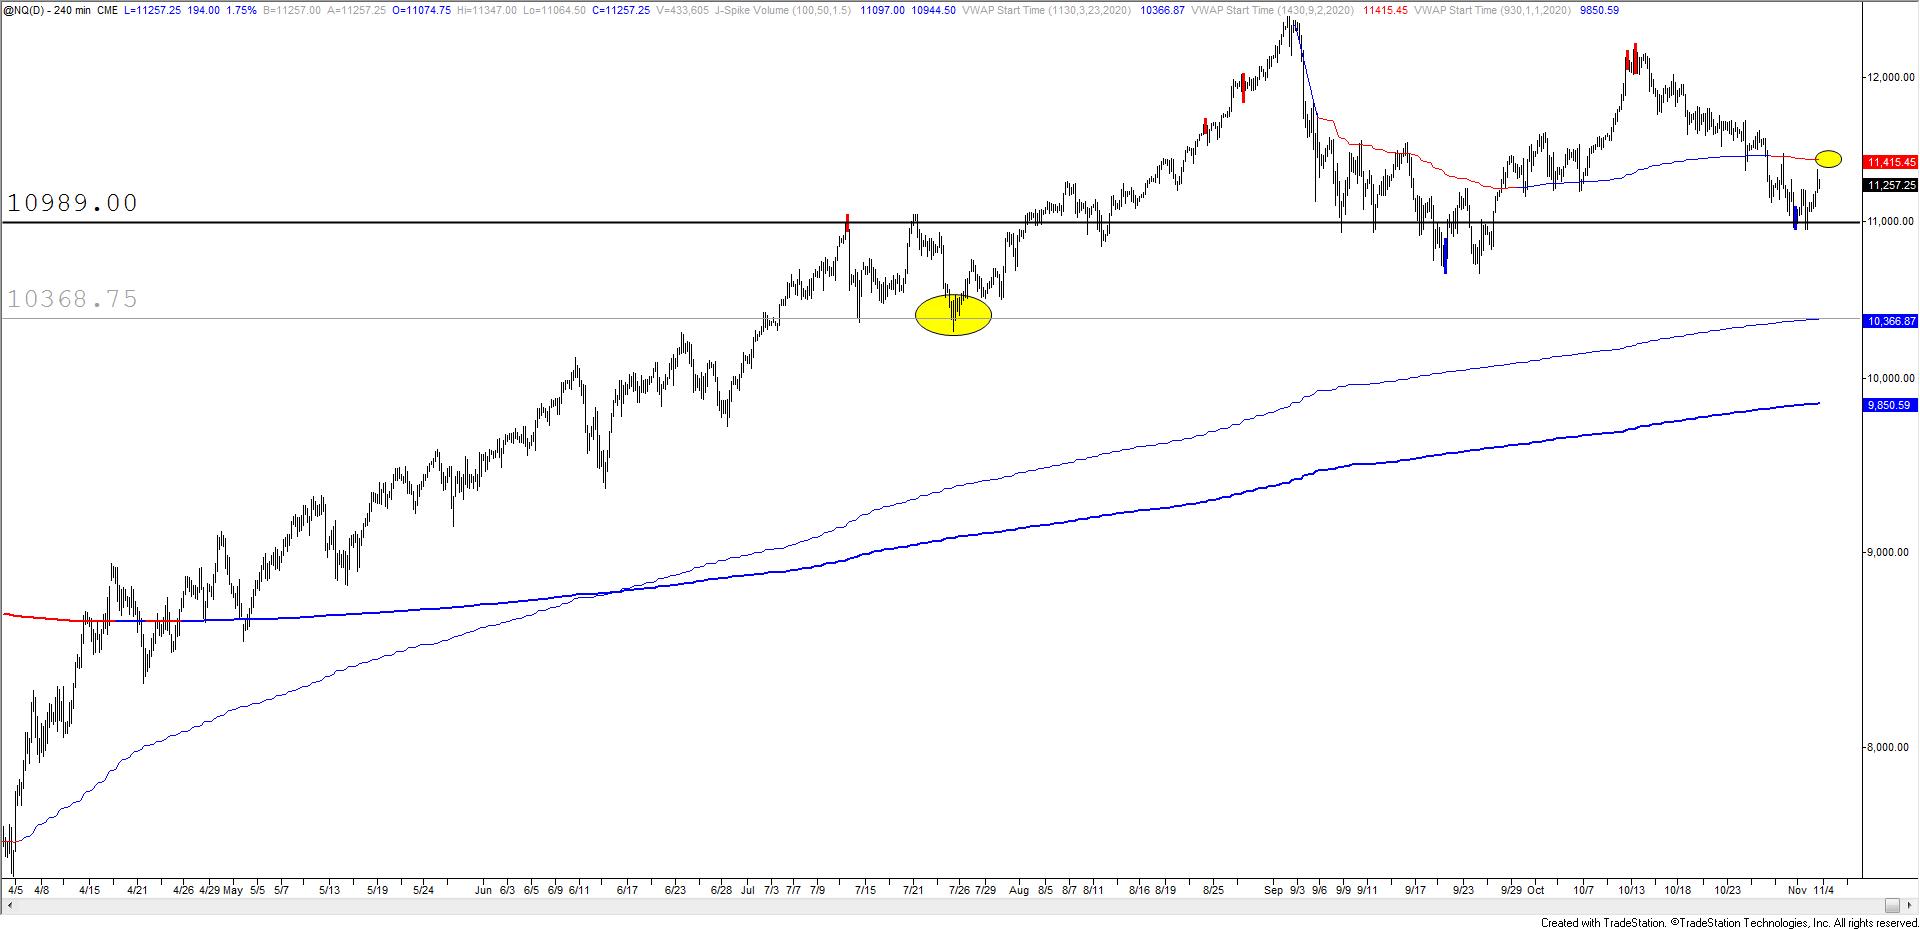
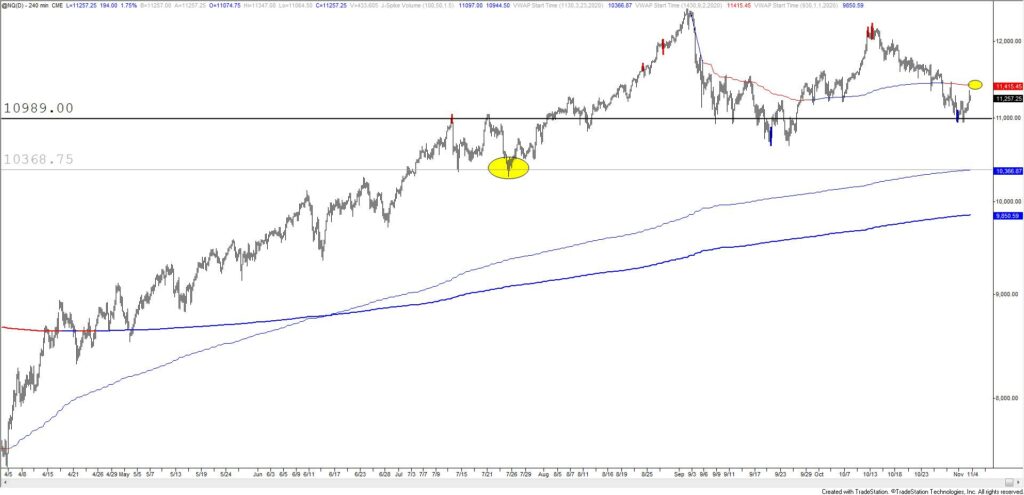
We got the bounce as suspected and Nasdaq futures are approaching proposed resistance near 11415. I’m on alert for a turn lower from that level.
November 2, 2020

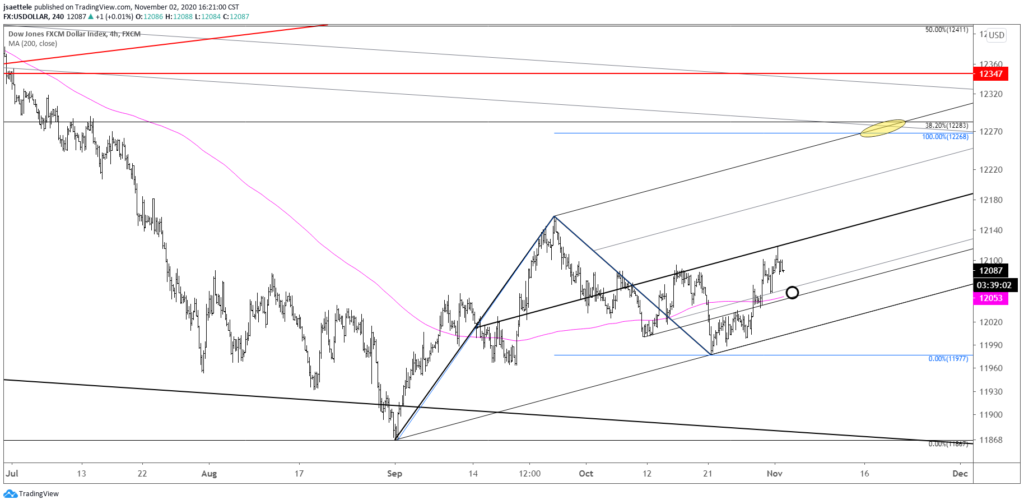
USDOLLAR traded into the center line of the channel from the September low today and immediately pulled back. Proposed support is 12050 or so. The top of the channel intersects where the rally would consist of 2 equal legs at 12268 on 11/18. The 38.2% retrace of the decline from the March high is just above there at 12283 and the 200 day average is currently 12284 (see below). So, a slight pullback and then higher? It certainly ‘fits’ with general seasonality and election seasonality.
October 29, 2020

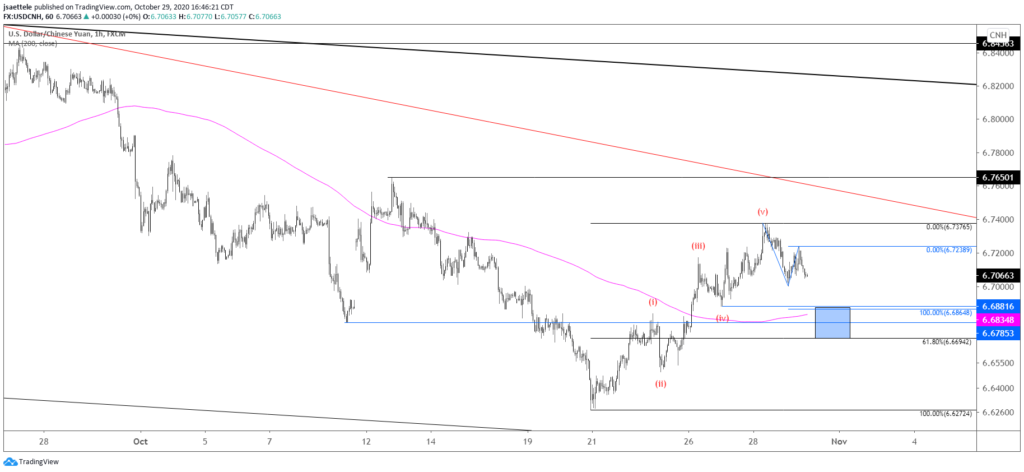
The USDCNH, DXY non-confirmation nailed the turn again. Upside is favored for the USD over the next few weeks but there are reasons to suspect that the USD pulls back slightly (so maybe a bounce in equities too). USDCNH pattern is one of those reasons. The rally from the low is in 5 waves so expectations are for a 3 wave pullback. That pullback is underway. The proposed support zone is 6.6690-6.6880.
October 28, 2020

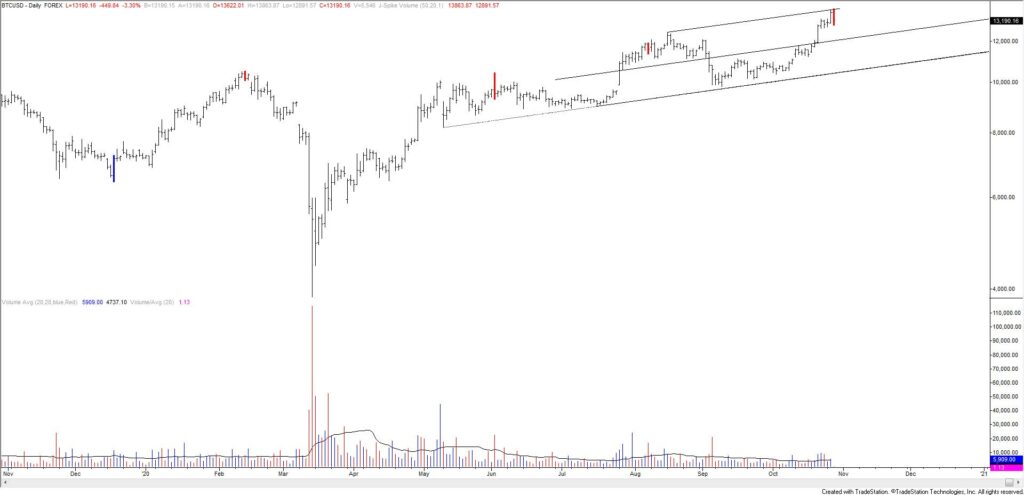
Bitcoin made a volume reversal today. The high was right at the top of a channel too. The longer term chart is extremely bullish but price could drop to back to 10,000 or just below and still be bullish on a longer term basis. Near term, the BTCUSD reversal lower doesn’t bode well for ‘risk assets’ in general. No, BTCUSD is not a ‘safe haven’. It’s been moving with everything else all year. The ONLY safe haven in the current environment is the USD (maybe Yen and US treasuries too).