Education
April 8, 2022

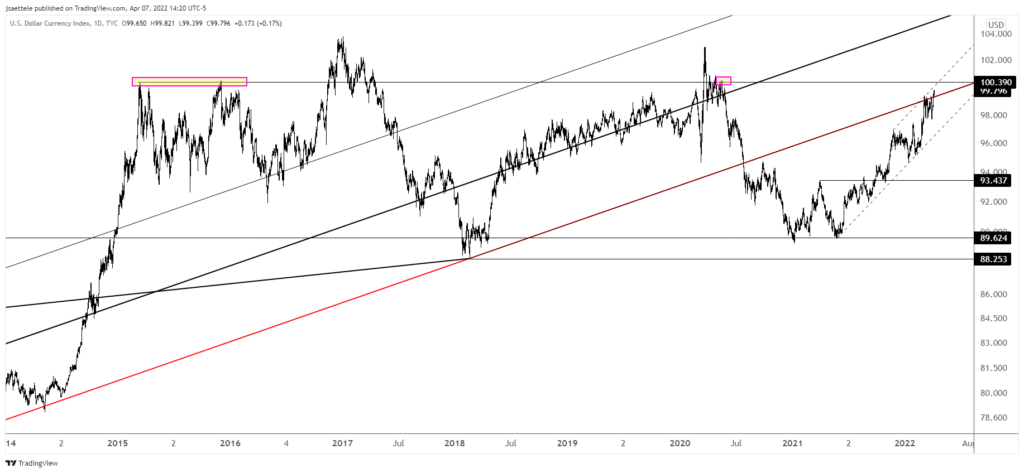
The ‘final leg higher’ option is unfolding in DXY. A key zone to pay attention to is 100.39/59. This is a well-defined horiztonal and where wave 5 would equal wave 1 within the sequence from the January low. Also, note that EURUSD has yet to trade beneath its March low. It may very well do so but a non-confirmation is in place until that happens.
April 6, 2022
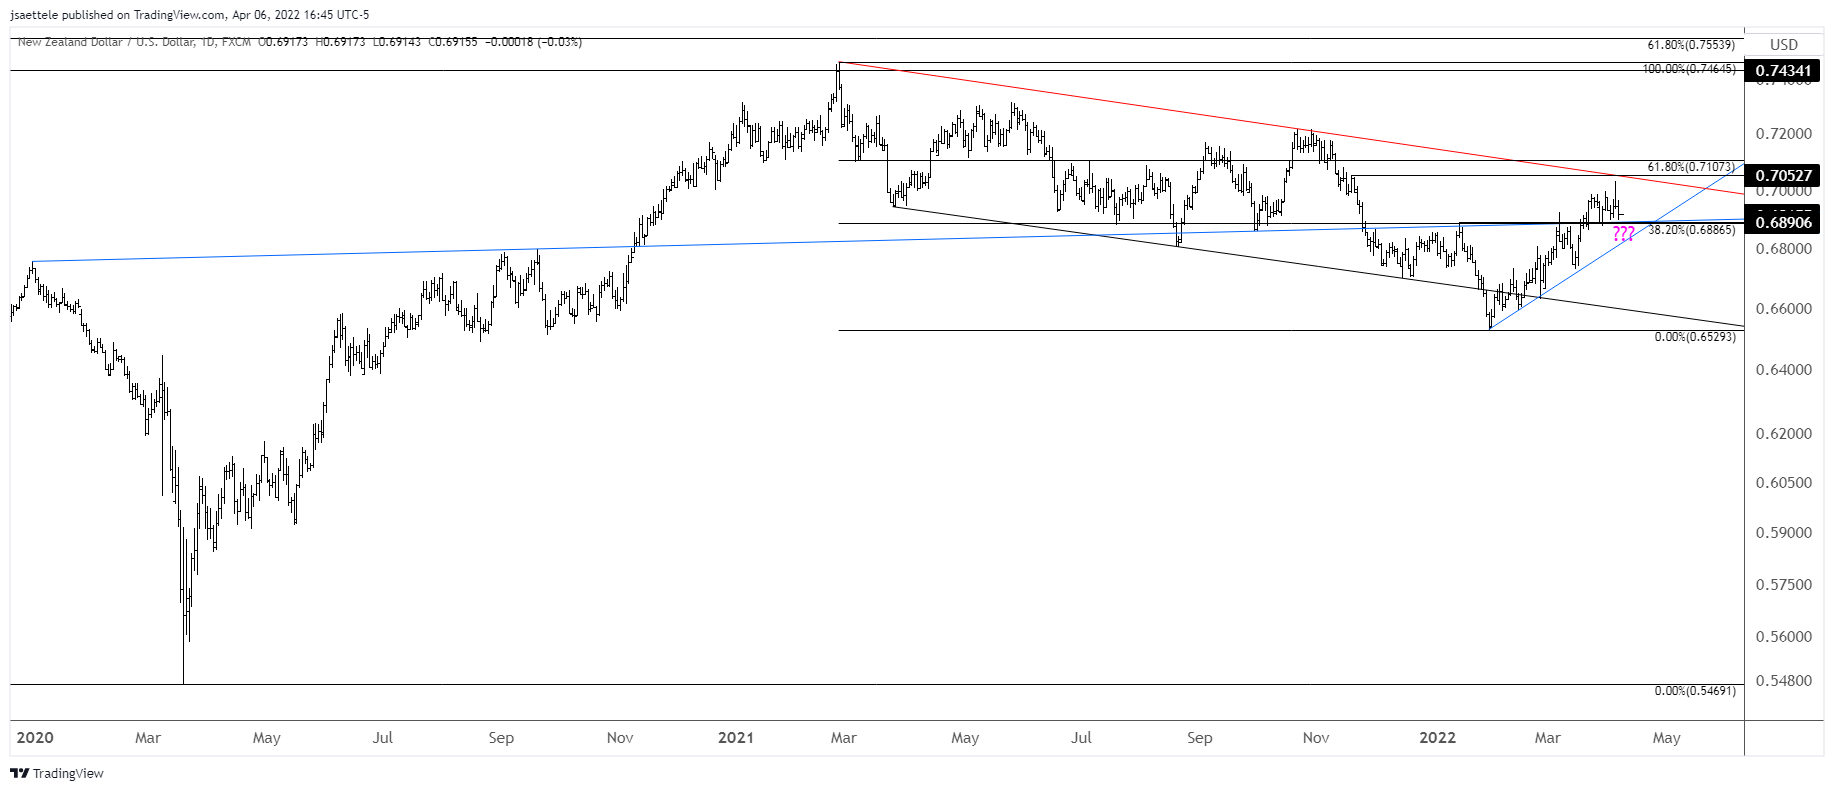
I’m torn on Kiwi given the prospect for a deeper AUDUSD pullback. In any case, continue to be aware of the long term neckline (blue line), which has been resistance and support so far in 2022. The line is about .6890. If we get a decent reaction at that level, then it will be worth taking a shot on the long side with a tight stop.
April 6, 2022
Today’s post is extremely short as I’ve been having tech issues throughout the day.
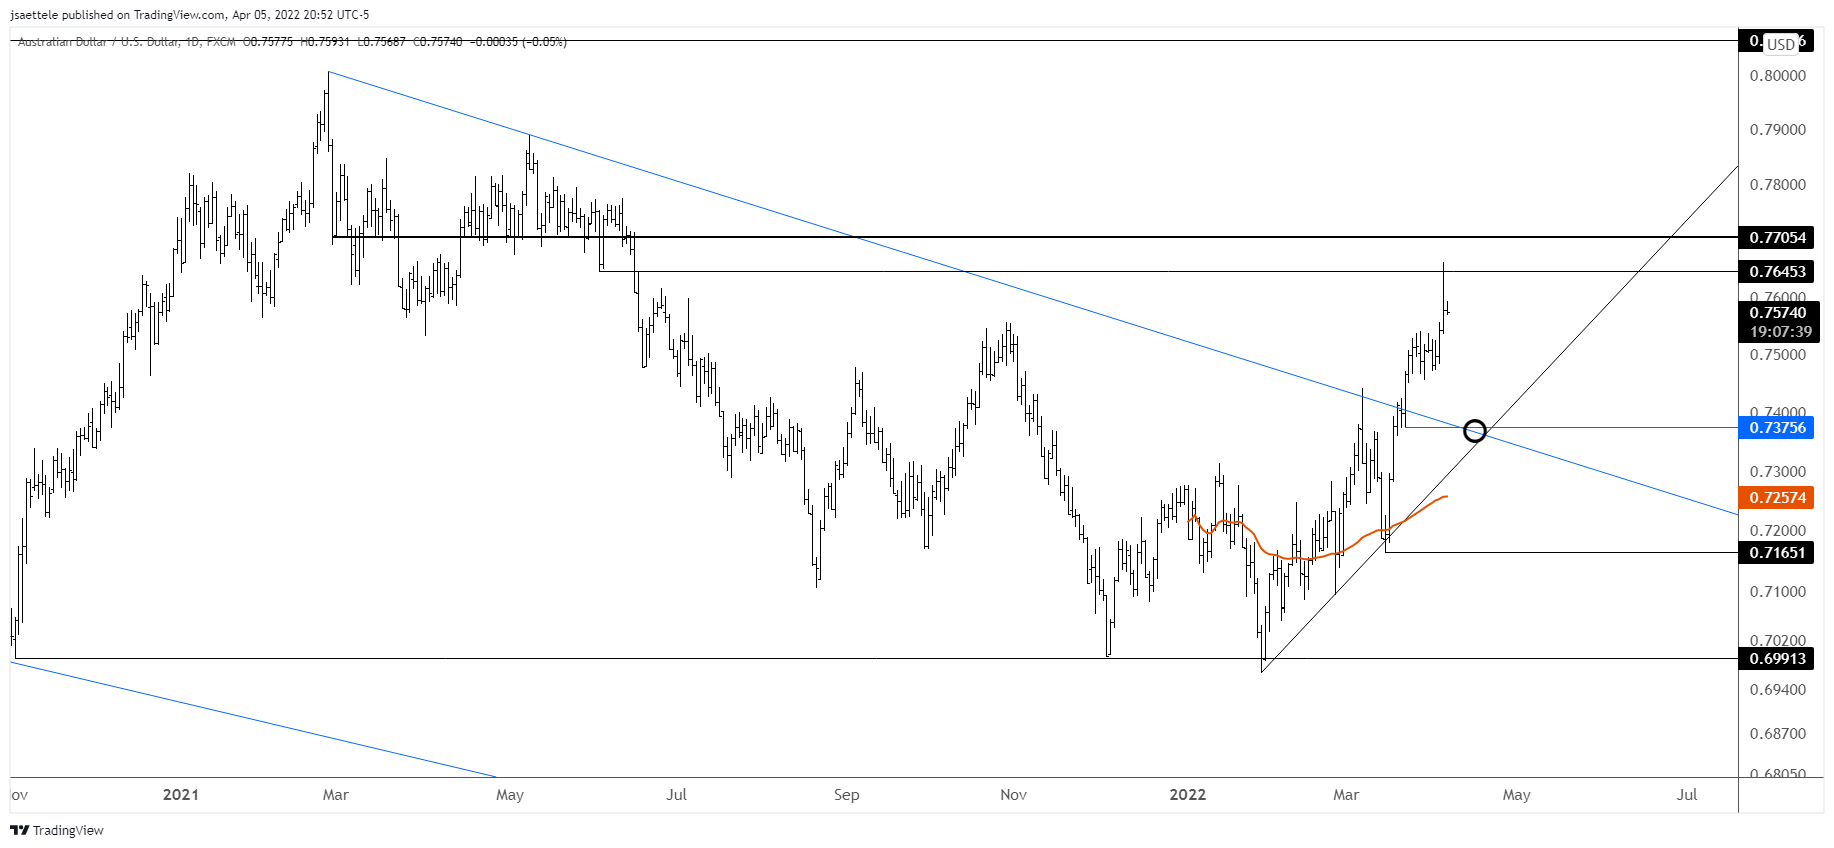
Tuesday’s Aussie spike on ‘news’ (RBA) has top written all over it. Price spiked into and reversed from a well-defined level (61.8% retrace of the decline from the 2021 high and former support) following RBA. Perhaps we’ll finally get the pullback into the top side of former trendline resistance (blue line), which is near .7375 now.
March 31, 2022
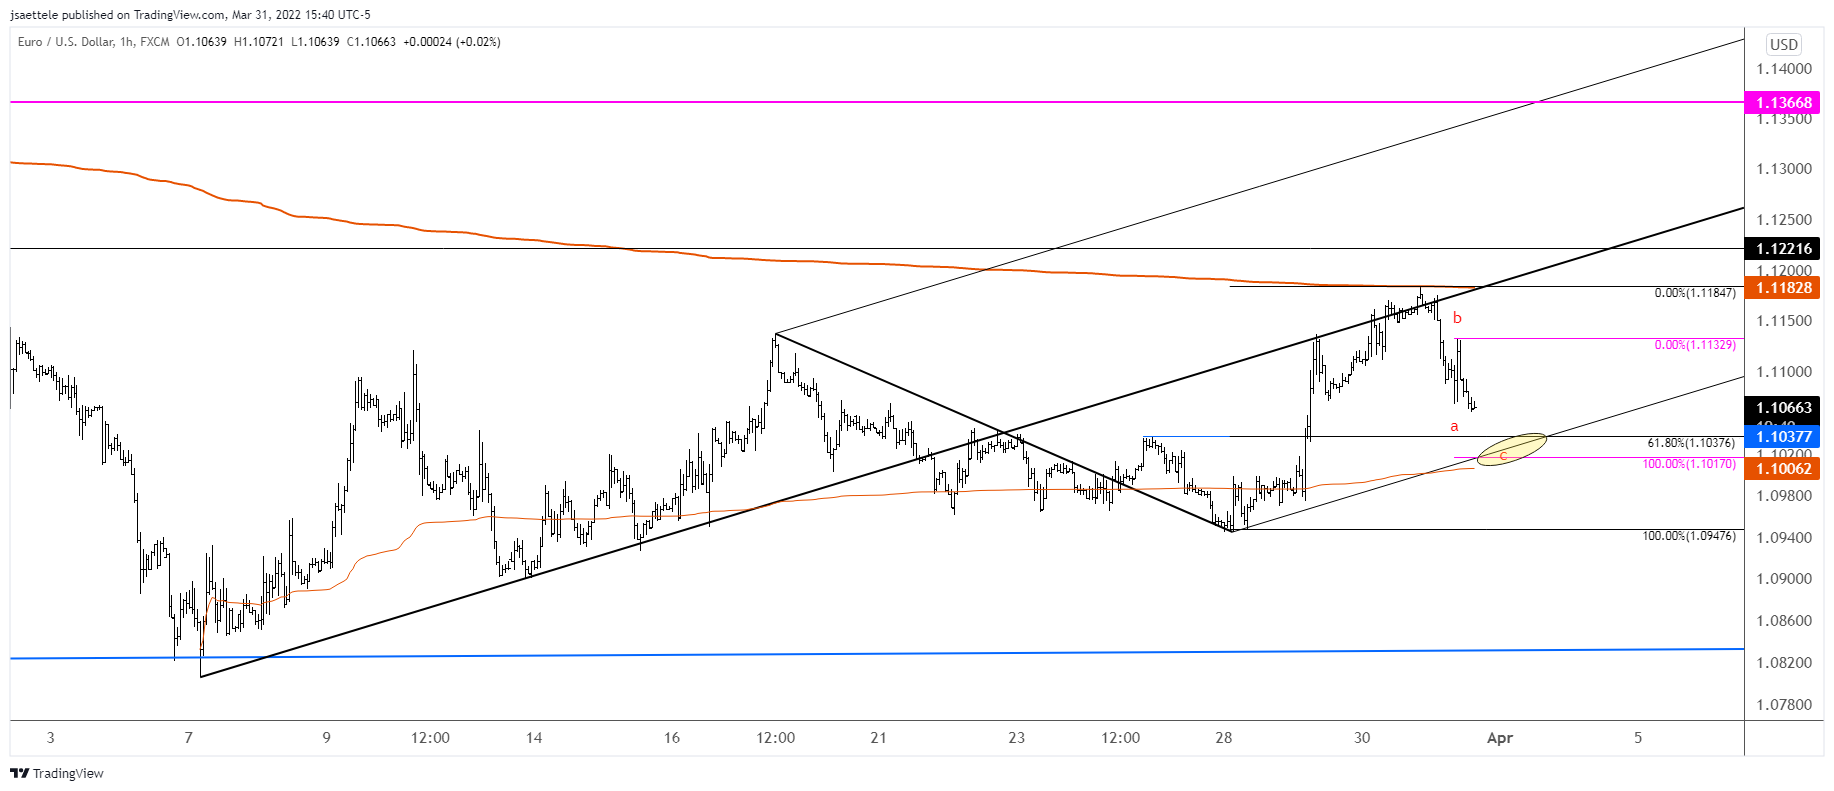
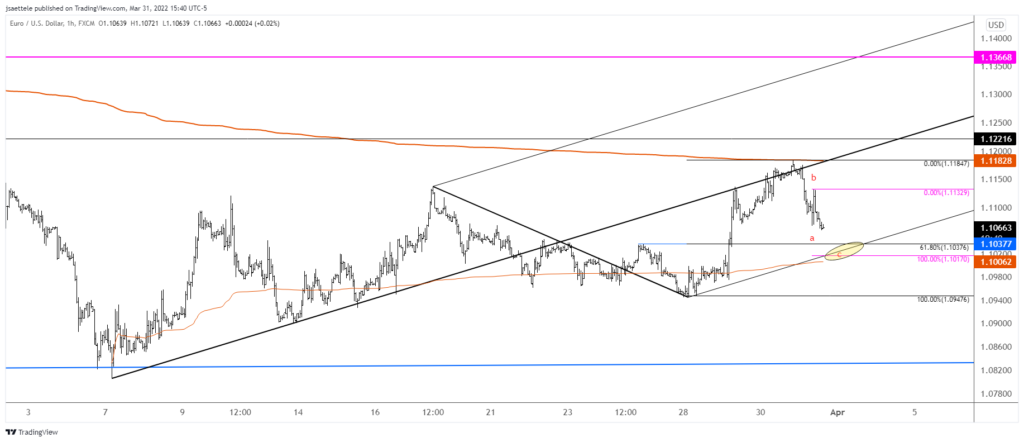
EURUSD appears to be completing an A-B-C decline from the 1.1185 high. The decline would consist of 2 equal legs at 1.1017 and the 61.8% retrace of the latest leg up is 1.1038. The lower parallel from the short term bullish fork is in line with these levels. Bottom line, look slightly lower before the next leg up gets underway.
March 31, 2022
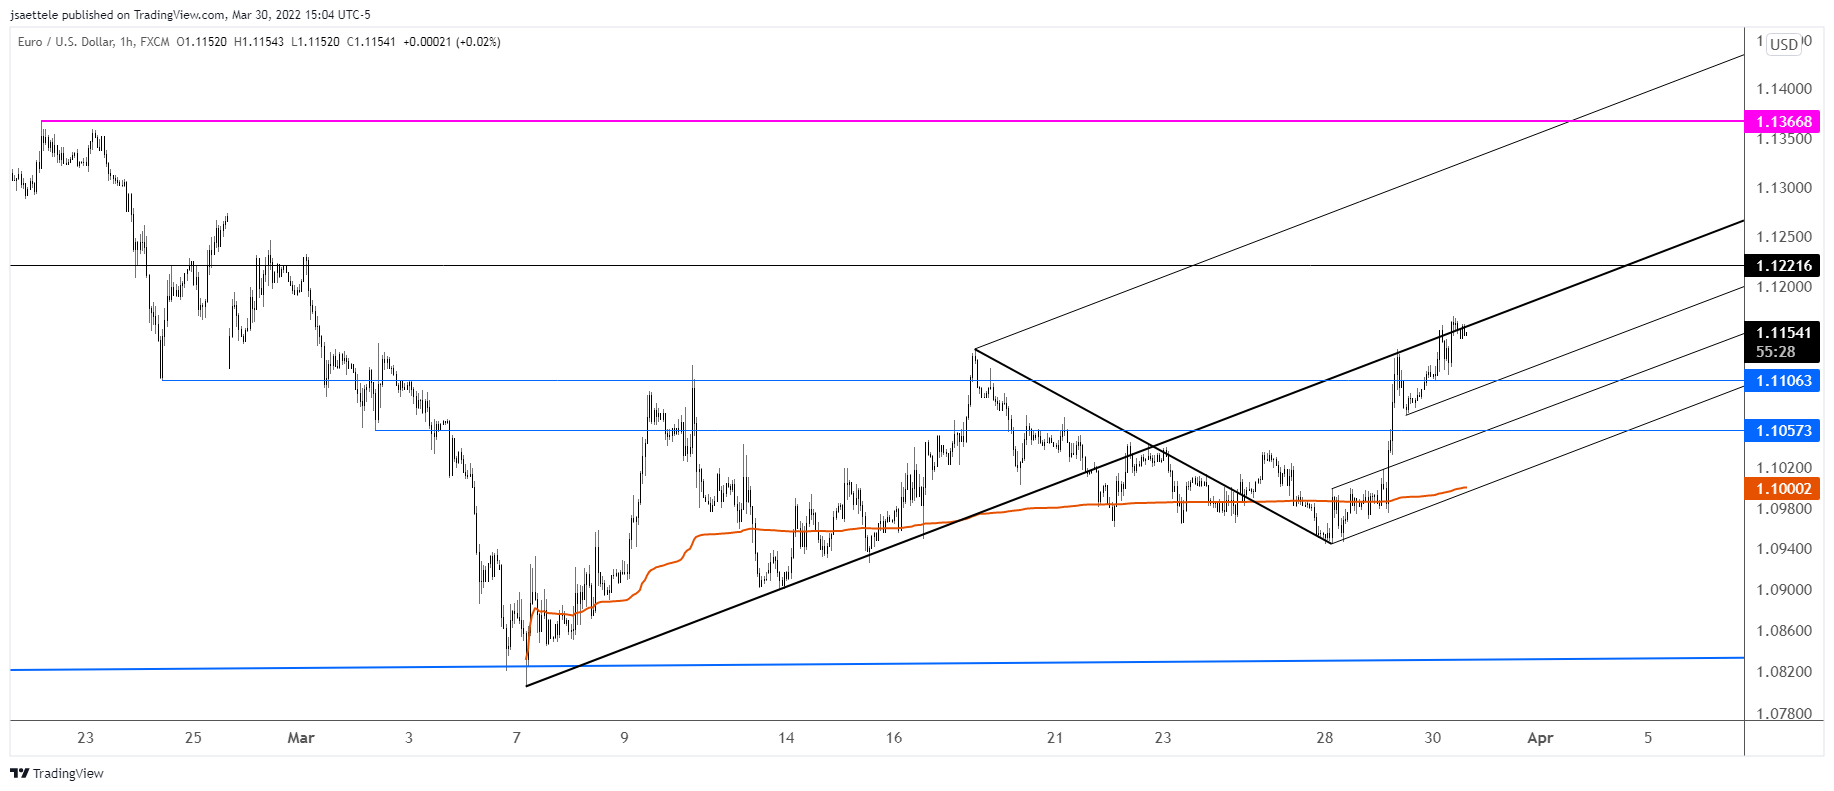
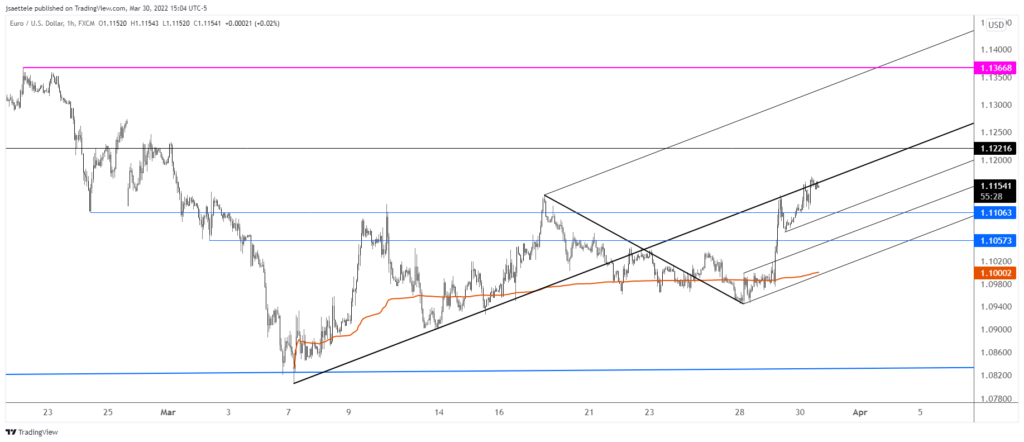
1.1218/30 remains in focus but I’m wondering if EURUSD is trading within a much more bullish structure. Notice how price has been riding the median line of the presented fork the last 2 days. This suggests that the structure is ‘in play’. So, either price pulls back and finds support on a related parallel…probably near 1.1106 or 1.1060 or EURUSD explodes higher now. If the latter happens, then the top side of the center line becomes proposed support.
March 29, 2022
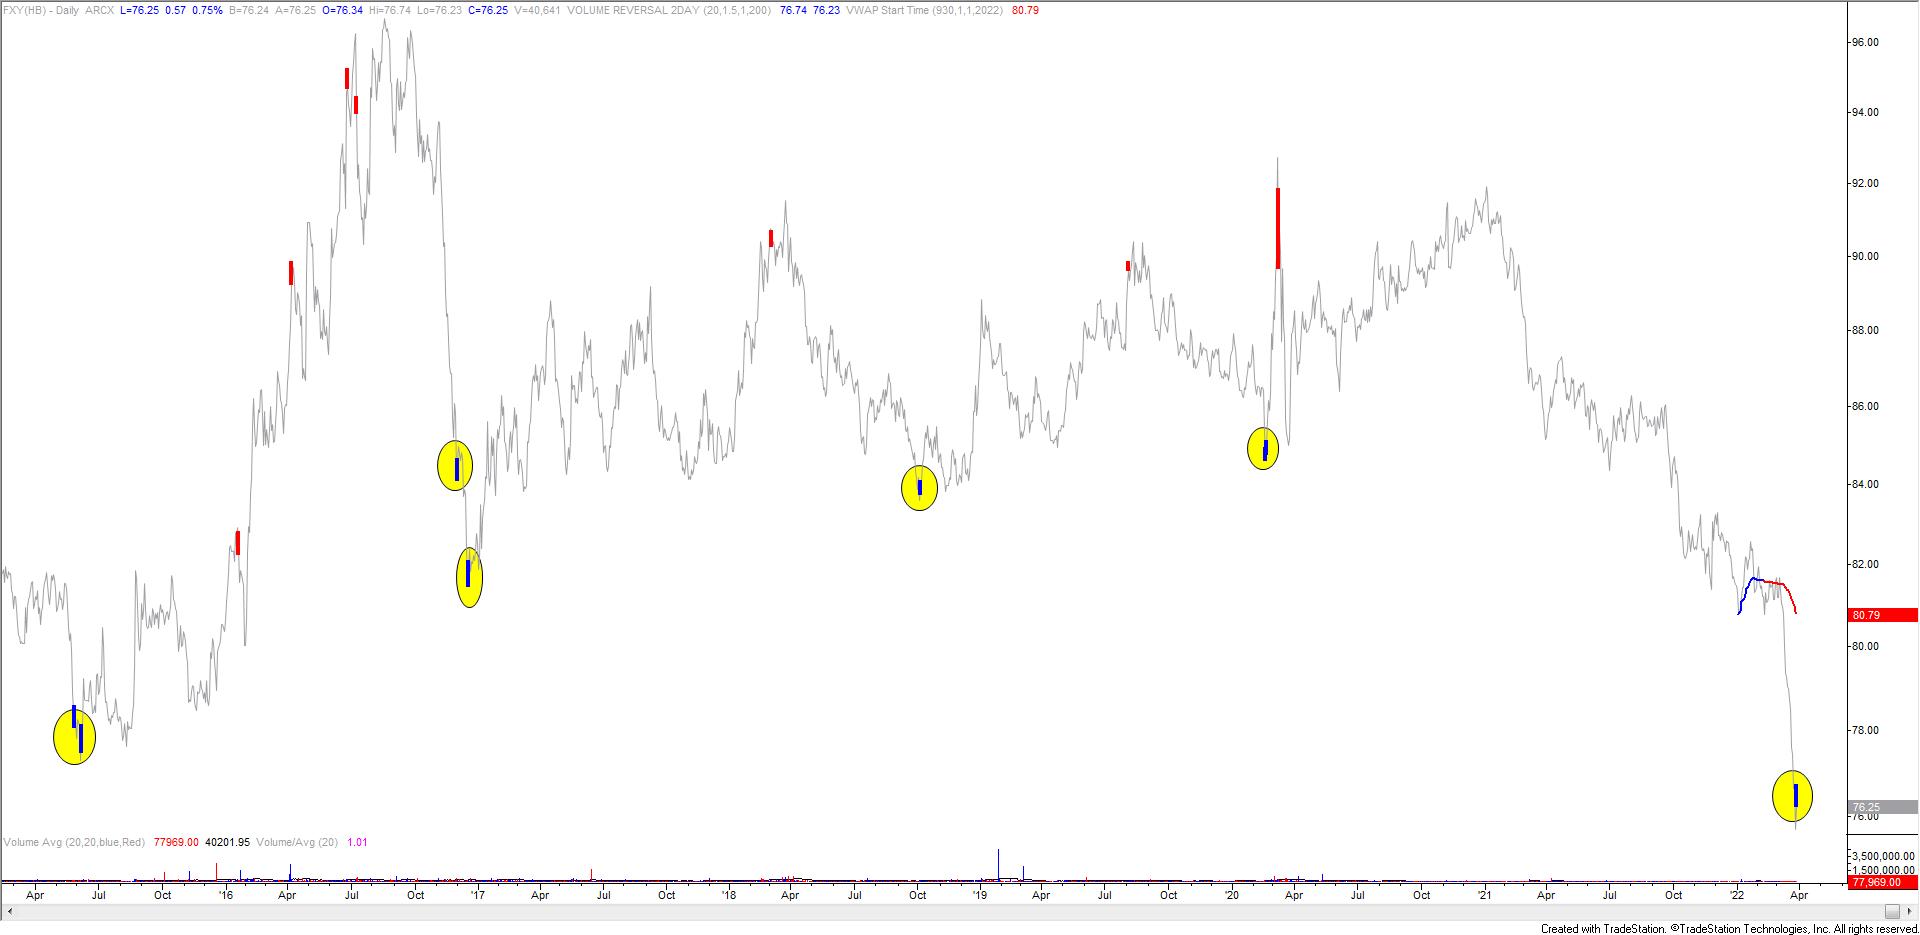
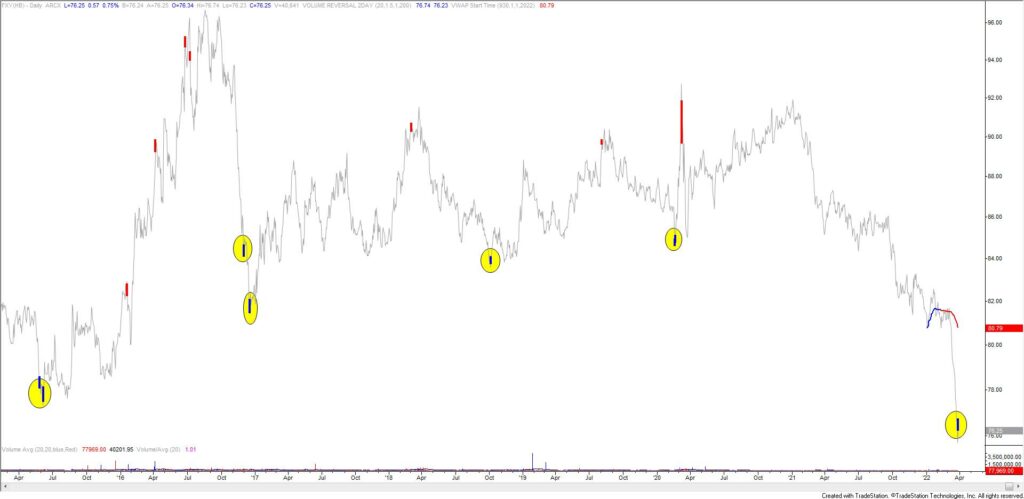
FXY (Japanese Yen ETF) completed a 2 bar volume reversal today. I’ve highlighted all of the bullish reversals since 2016. All but one of the signals nailed the turn. Signals on the other side were reliable as well. Be aware that this chart plots JPYUSD so bullish signals are bearish USDJPY signals. On the spot chart (see below), 123.15/50 should provide resistance if a tradeable high is in place. The top of this zone is VWAP from the high, which has proved useful so far in identifying resistance. The next levels of interest on the downside are 121.40 and 120.40.
March 28, 2022

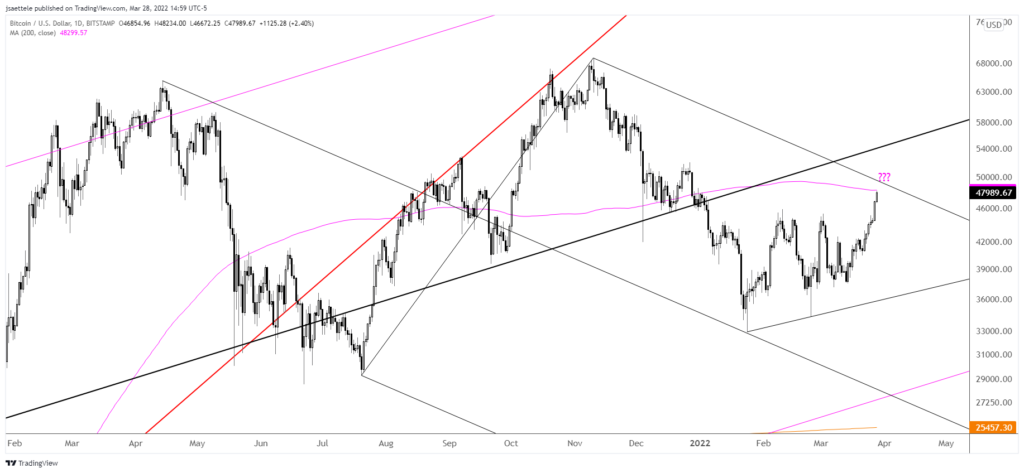
The triangle scenario described last week is no longer valid in BTCUSD. However, note that price has reached the 200 day average and the upper parallel from the median line of the fork that originates at the April 2021 high is slightly higher…near 49500. Pay close attention to that level for resistance if reached because since the January low registered right at the median line.
March 25, 2022

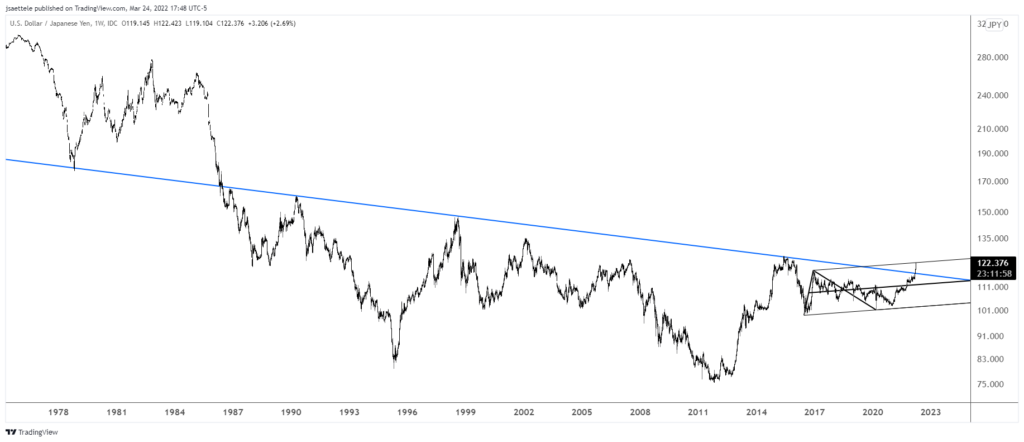
Yen crosses are going through the roof. On a very long term basis, the evidence suggests that they could go A LOT higher. For example, the weekly chart below highlights the breakout above the trendline that originates at the 1990 high! That’s significant. In the near term however, my ‘guess’ is that a pullback is around the corner. USDJPY is closing in on the noted channel from the 2016 low. That’s about 122.70. Major support is anywhere between 117.00 and 118.60s.
March 24, 2022

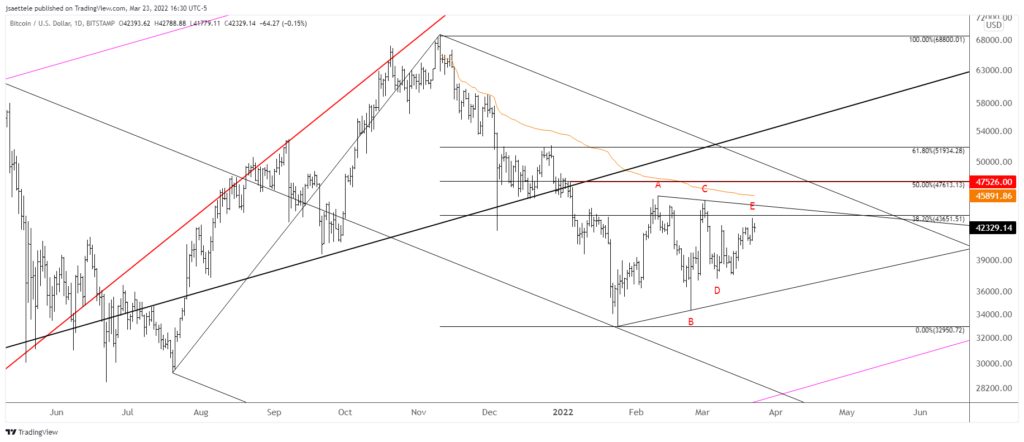
Everything since the January low in BTCUSD appears to be a triangle. Triangles typically break in the direction of the prior move…in this case that would be lower. Under Elliott, triangles consist of 5 waves labeled A-B-C-D-E. BTCUSD clearly sports 5 waves since the January low. The implication is that price rolls over soon and eventually breaks beneath the January low.