Education
October 20, 2020
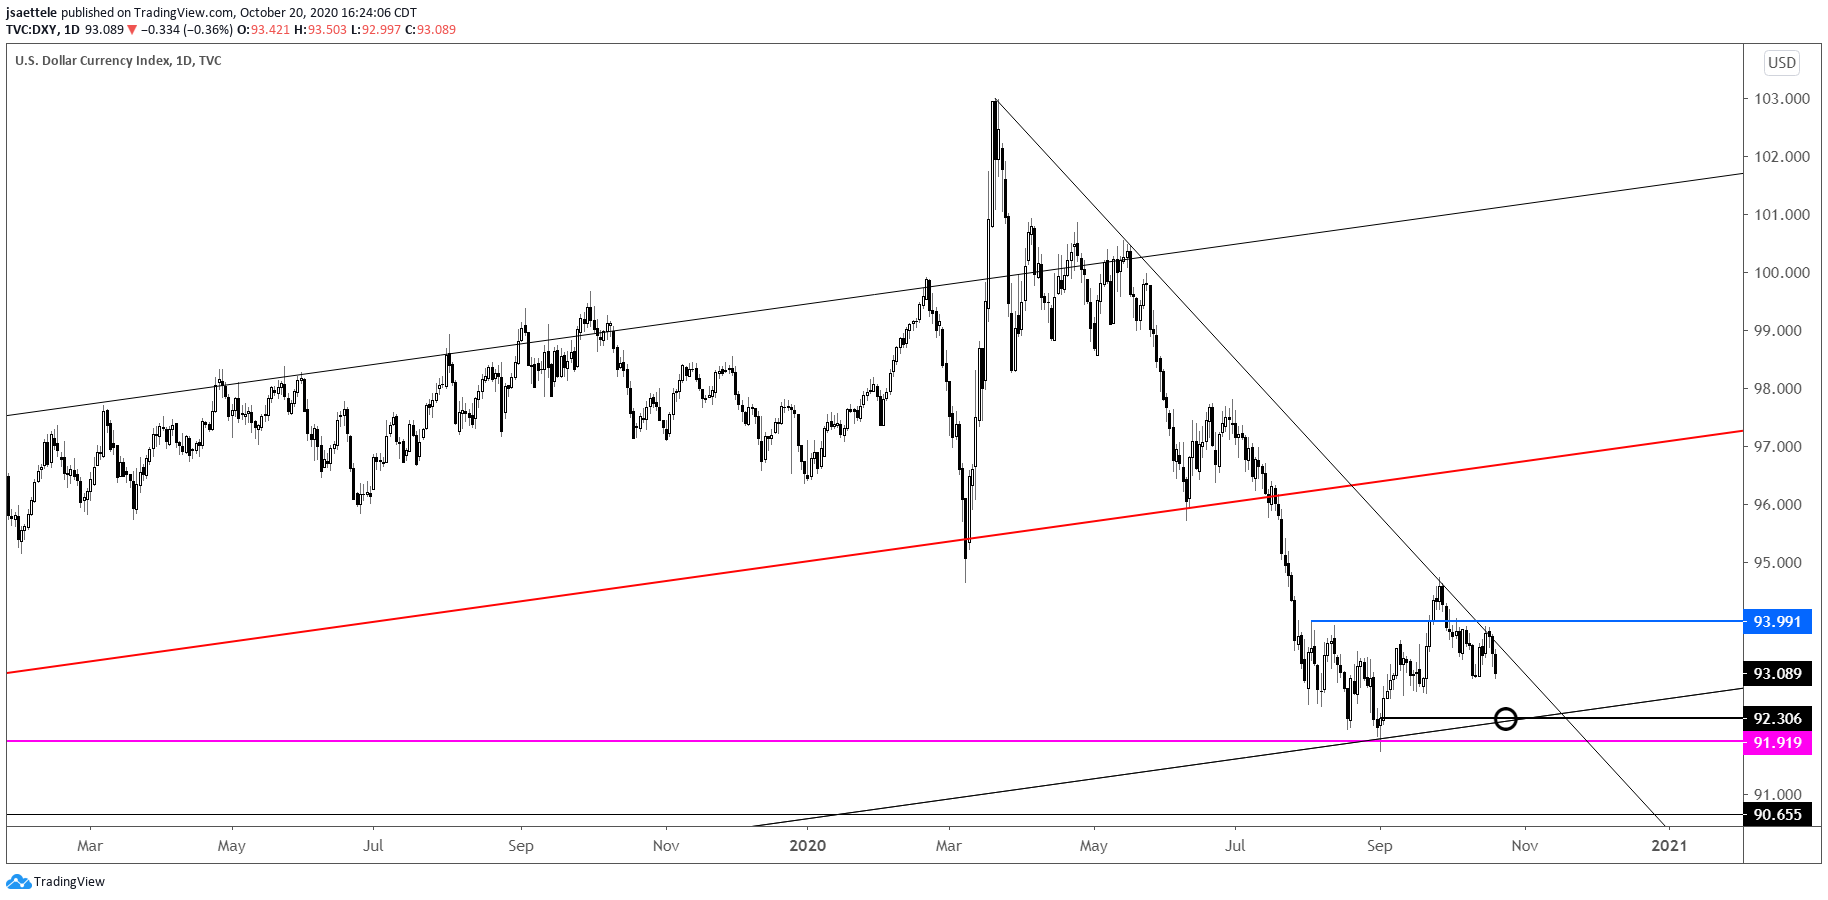
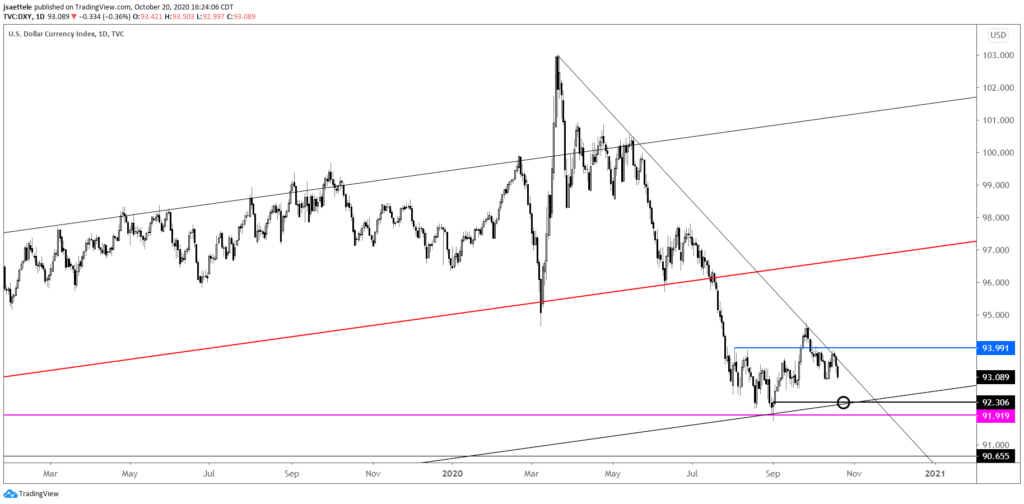
DXY continues to fail at channel resistance and ABOVE 94 is still needed to signal that trend has shifted from sideways to up. Until/unless that happens, be aware of another test of the long term support line near 92.30 (daily reversal support). 2 equal legs down from the 9/25 high would be 92.18. A longer term chart is shown below in order to remind that important support is under the market.
October 19, 2020

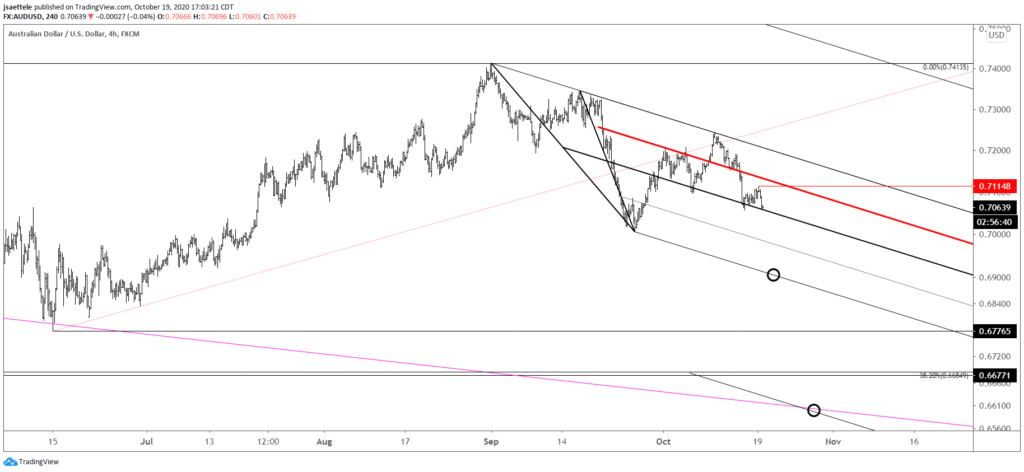
AUDUSD is pressing the center line channel center line again. The risk is for accelerated weakness following a break below the center line. Immediate focus would be the mentioned lower parallel near .6900. A break there opens up the channel extension, which intersects the top side of the trendline from the 2018 high near .6600. Resistance should be .7080s now.
10/15 – AUDUSD broke down and stabilized near the center line as suspected. Proposed resistance now is the 25 line, which has been resistance and support over the last few weeks. That is about .7135. Near term bearish focus is the lower parallel (extended off of the 9/25 low) near .6900.
October 16, 2020

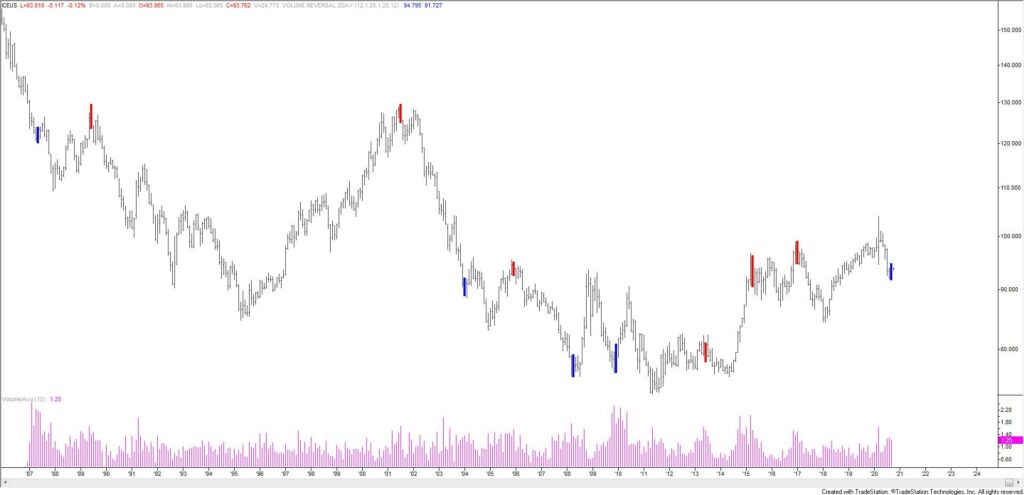
DX futures made a 2 bar monthly volume reversal in September. This means that August was a high volume up month and at least a 12 month closing high and September was a high volume down month. This is the first bullish signal since December 2010. UUP ( Dollar ETF) also made a monthly volume reversal. Price history begins in 2007 but this is the 4th bullish reversal since then. The prior 3 nailed major turns. The 2 bearish reversals also nailed turns.
October 15, 2020

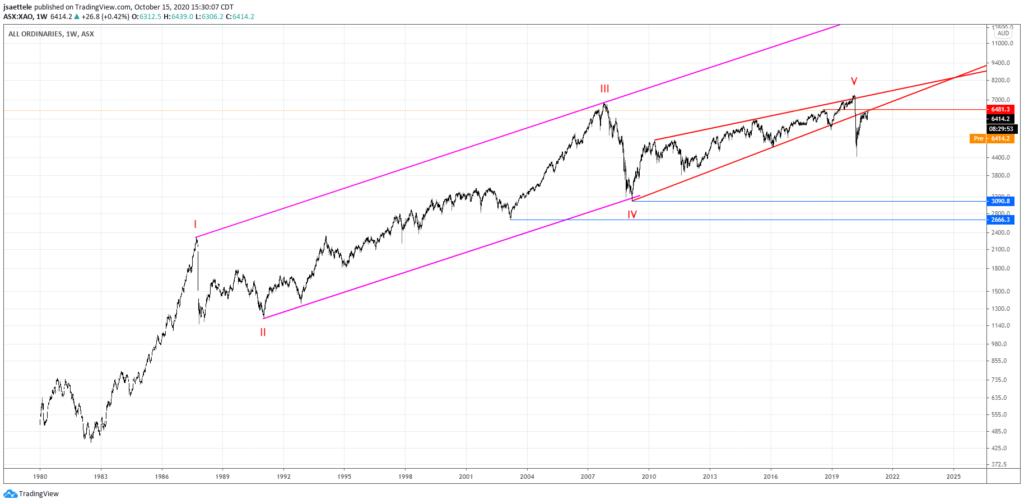
Australia’s All Ordinaries Index (local currency terms) is pressing against the underside of former trendline support. In fact, the rally from 2009 is an ending diagonal (wedge in classical charting) in the 5th wave position. Longer term, the entire rally from 1982 counts in 5 waves. The implication is that a long, drawn out corrective process is underway. Bottom line, the index is into well-defined resistance and I’m looking for price to roll over.
October 14, 2020

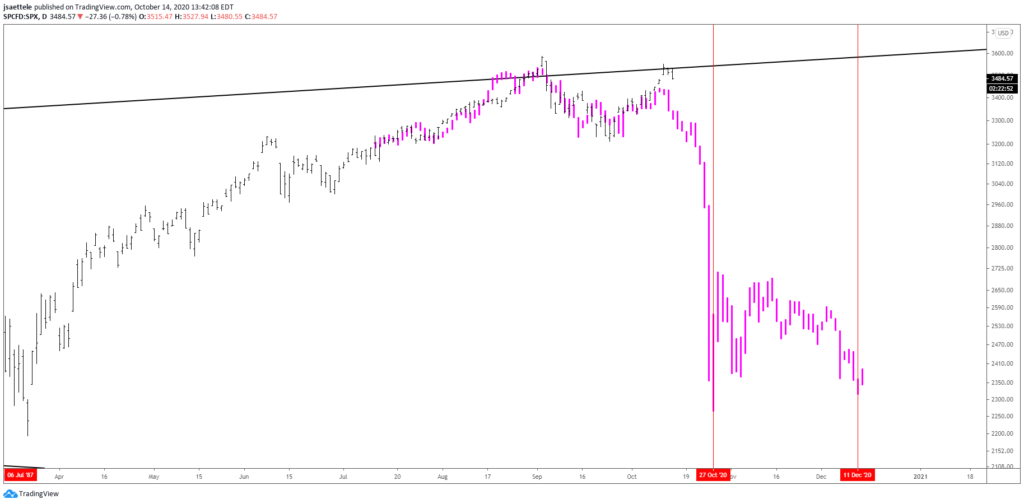
The top 3 month EidoSearch is the 3 months leading up to the 1987 crash. This is not a prediction, simply an observation. Getting back to reality, 3428/55 is an important short term zone. The top of this zone is channel support. Weakness below would warrant a bearish position…then see what happens.
October 13, 2020

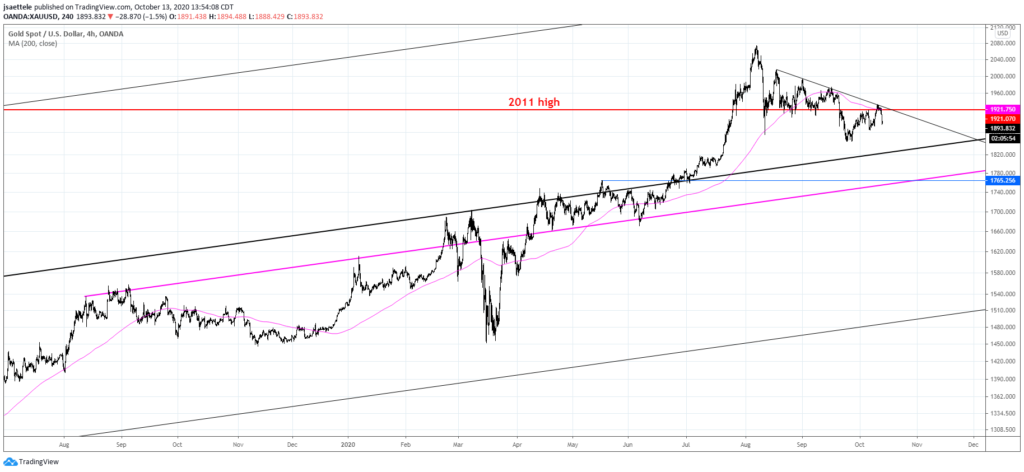
Gold has turned down from the 200 period average on the 4 hour chart, short term trendline, and 2011 high. Notice the action around the 2011 high over the last few months…gold remembers! Focus remains lower. 1760 appears critical for longer term support. This is the May high, near the 200 day average, and is a parallel that crosses highs and lows since August 2019.
October 13, 2020
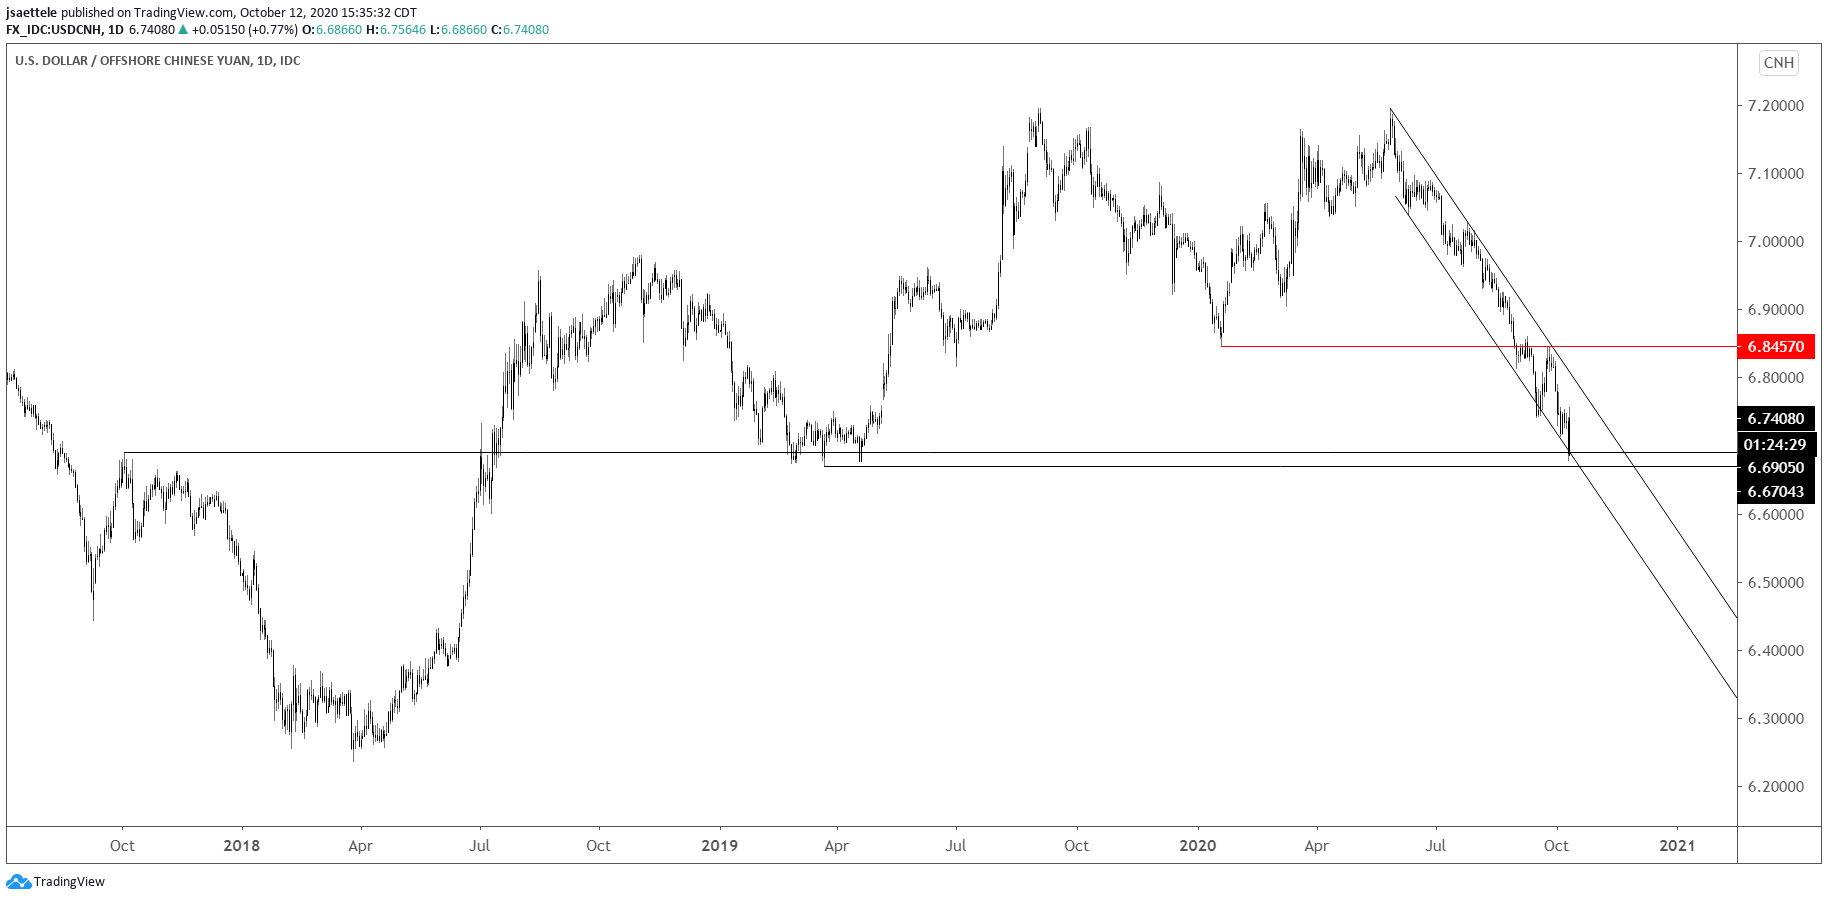
USDCNH has held a massive level defined by resistance in October 2017 and support from February-April 2019. Price has also turned up from the bottom of a steep bearish channel. The top of the channel is about 6.81. Strength above would be viewed as constructive. Also, the chart below shows USDCNH (in red) and DXY (in black) over the last 3 years. Every important turn was marked by non-confirmation between USDCNH and DXY. A bullish non-confirmation is in place as long as DXY is above its September low. Finally, DXY seasonal tendencies turn up now (5 year look back) and after this week (10, 20, and 30 year look backs).
October 9, 2020
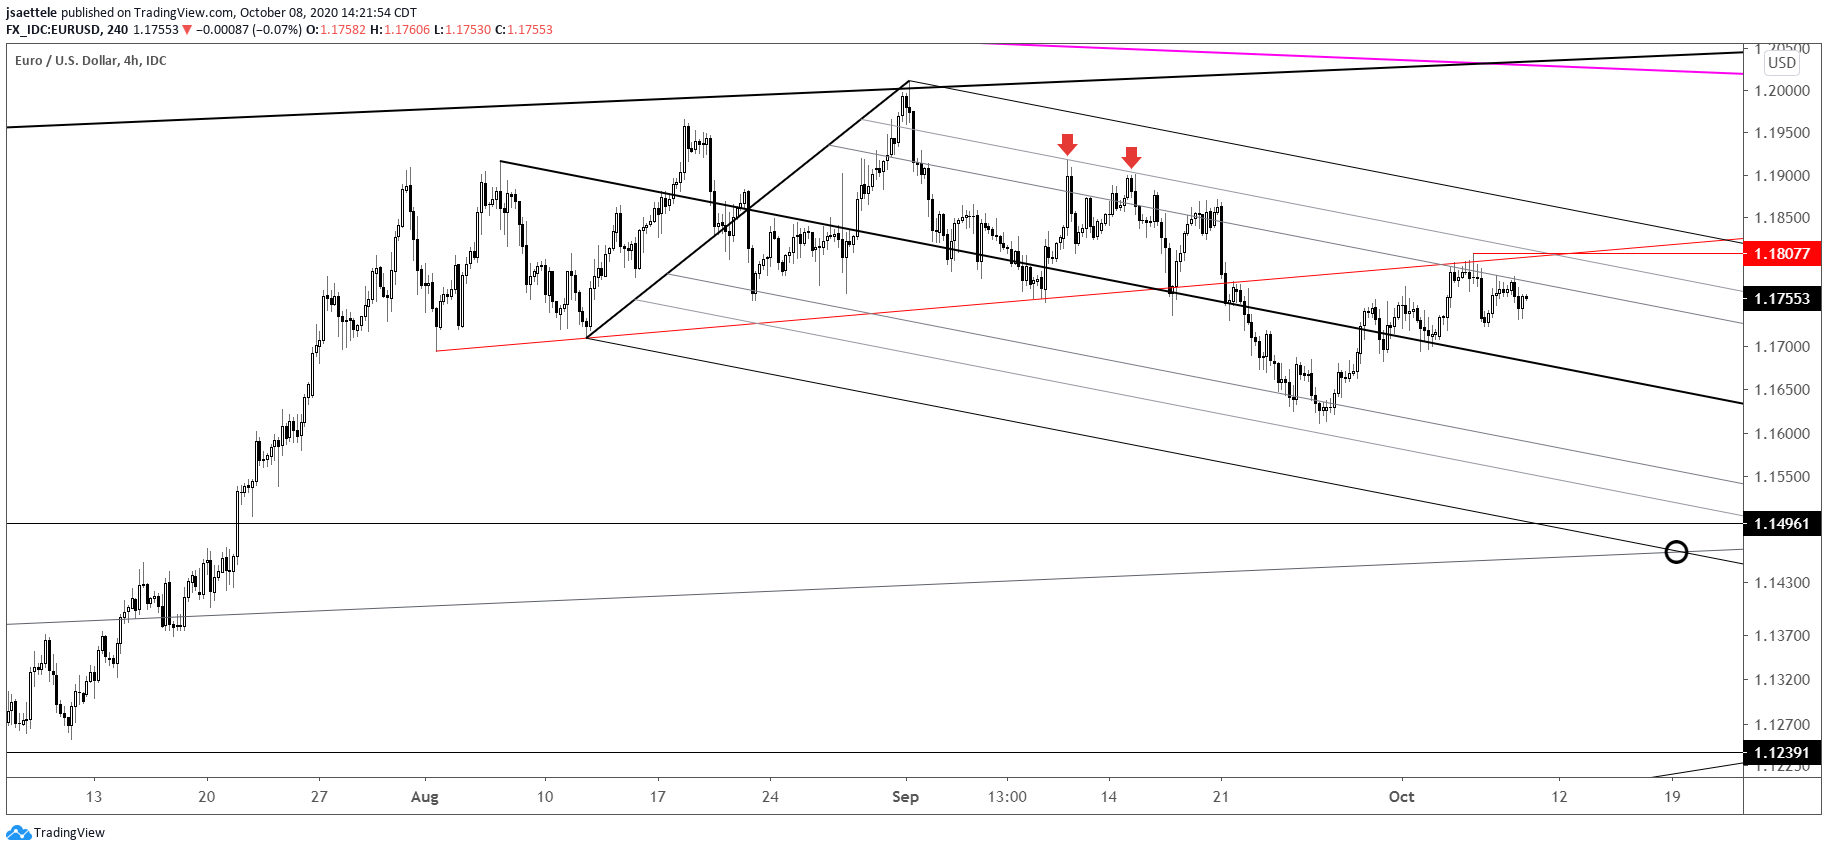
It’s awfully quiet out there. EURUSD is on pace for its smallest weekly range since 2/21, which of course is right before volatility exploded. Hopefully we get something similar now. My view on EURUSD hasn’t changed. Price continues to churn just under important resistance (neckline and VWAP). I’m presenting a new fork today. Notice how highs and lows since over the last month have been on/near the 25 and 75 lines within this structure. I ‘favor’ EURUSD holding below this resistance.
October 6, 2020
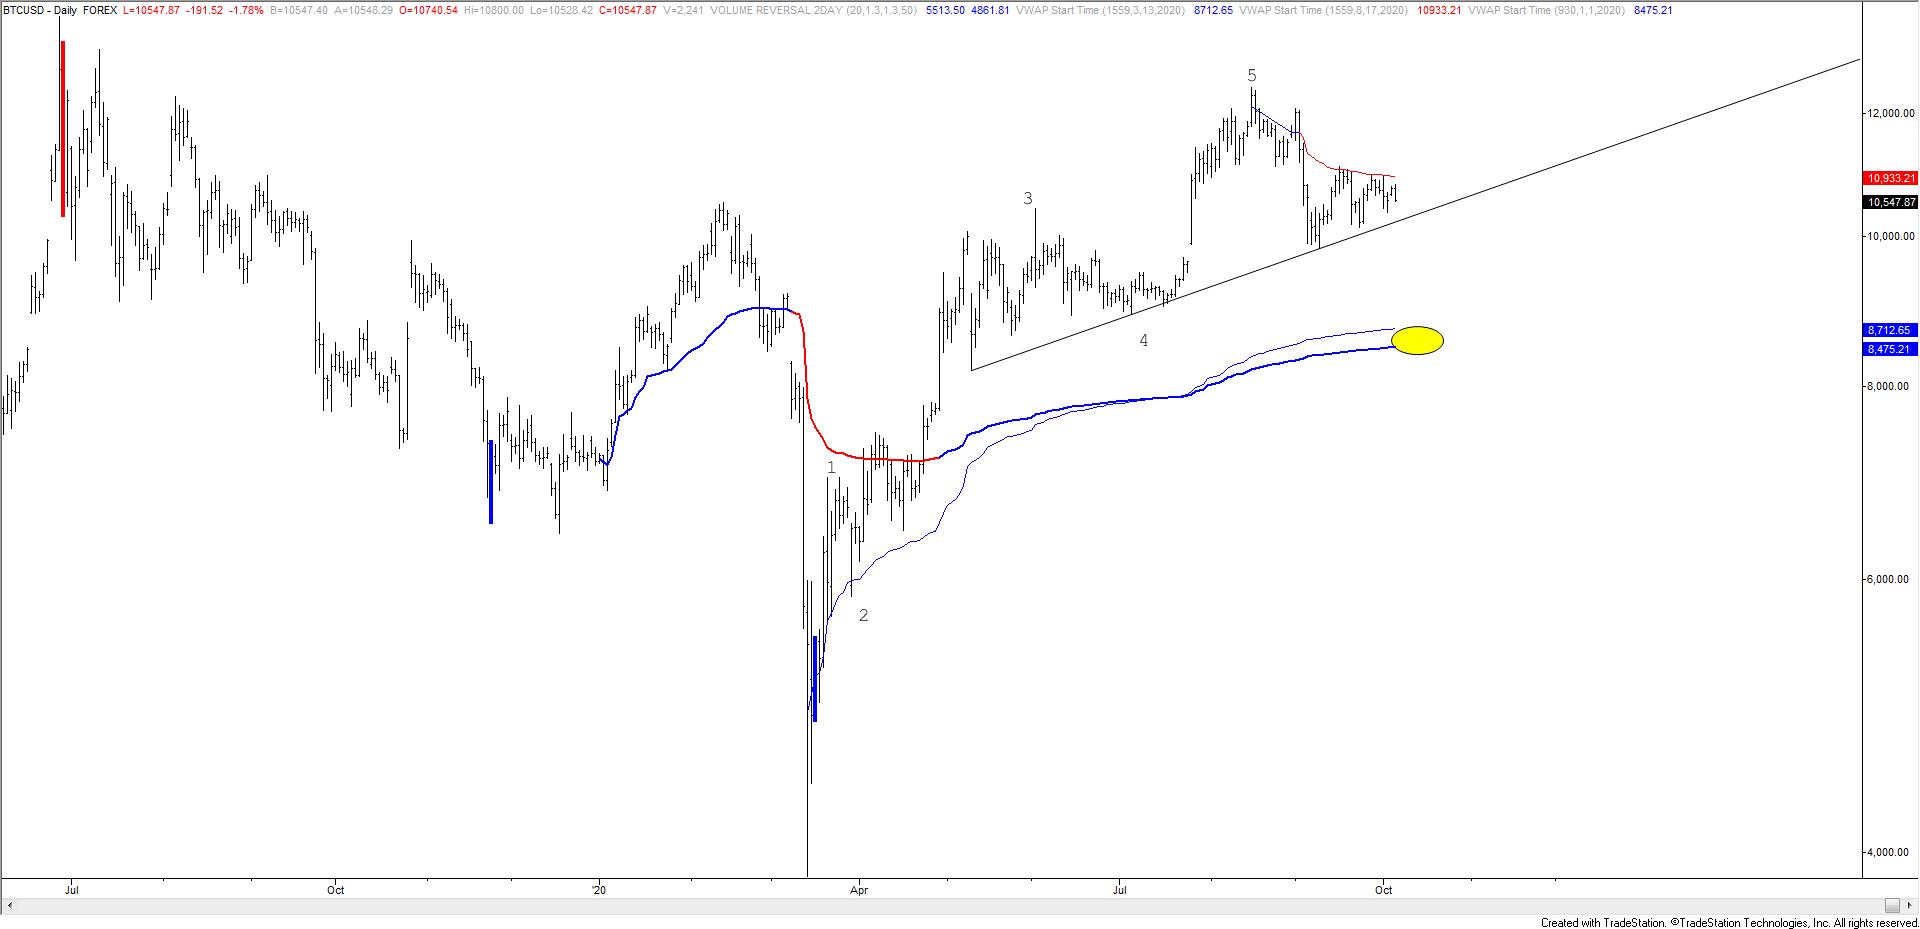
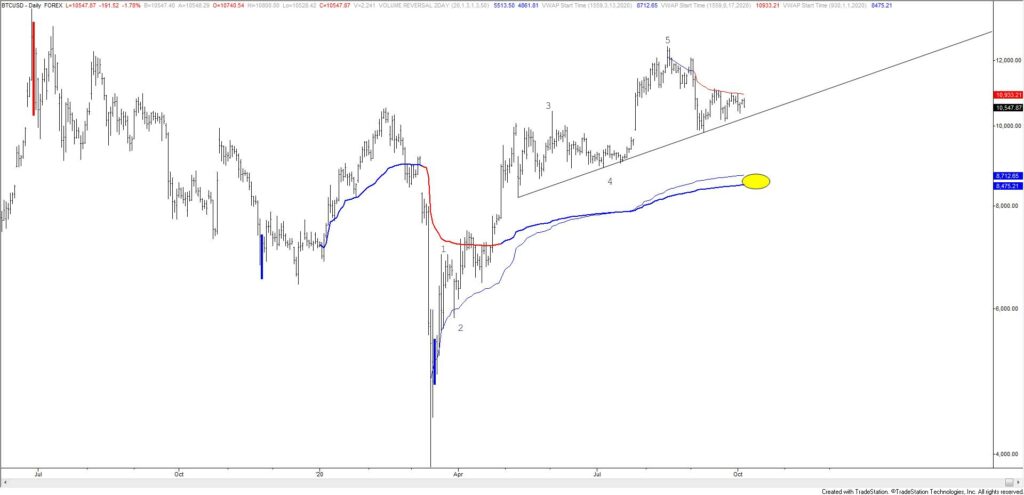
I’m leading with Bitcoin today but it could be more or less anything denominated in USD because it’s ALL THE SAME. Obsess over news if you must but there is one real reason for market moves since late March…the USD. USD up and everything else down. USD down and everything else up. The chart below illustrates this fact. Regarding BTCUSD specifically, VWAP from the high was resistance. A break under the trendline would open up VWAP from the low and 2020 VWAP in the mid-8000s. The Elliot pattern suggests that an important low could form in that vicinity because it’s also the area of the former 4th wave low.