COPPER FUTURES 4 HOUR
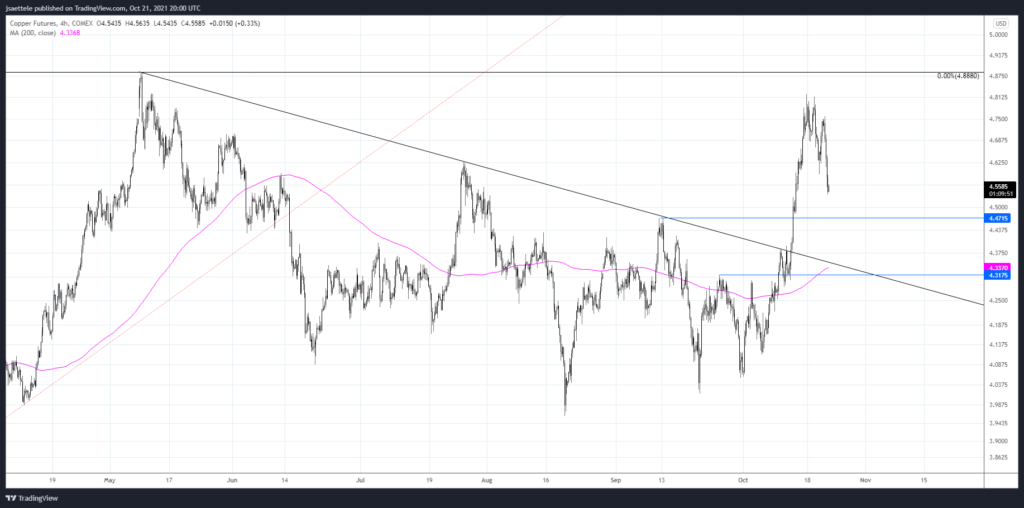
Copper has pulled back (down over 4% today). The top side of recent trendline resistance is the key level to pay attention to for support. That is about 4.35 over the next few days. That level needs to hold in order to maintain a broader positive outlook on ‘Dr. Copper’.
10/19 – Copper has carved 2 bearish wicks the last 2 days, raising the specter of a pullback following the breakout on 10/13. Former resistance is proposed support beginning at 4.4715. The bottom of the support zone is the top side of former trendline resistance near 4.3755.
USDOLLAR 4 HOUR
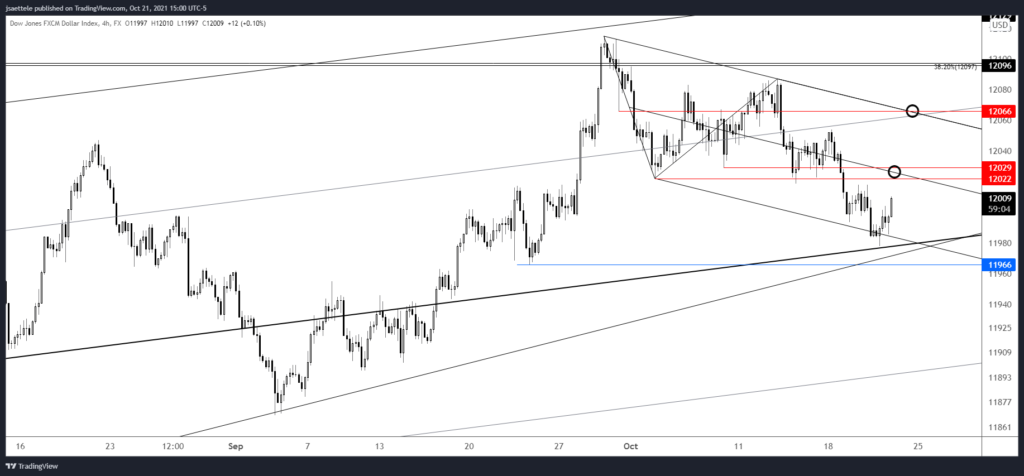
USDOLLAR turned up from corrective channel support. Again, my ‘view’ is that the buck has rolled over so I’ll be paying close attention to sentiment in the coming days. For example, strong USD forecasts would suggests that it’s time to short the USD. Price wise, pay attention to 12020s and 12060s for resistance.
10/20 – So much for ‘one more leg up’! USDOLLAR has dropped 5 of the last 6 days. The current level down to 11966 is defined by the July high, 9/23 low, and trendline that crosses lows in May, June, and September. This is a decision point so watch for a bounce. If the trendline breaks then there is nothing until the April high at 11929.
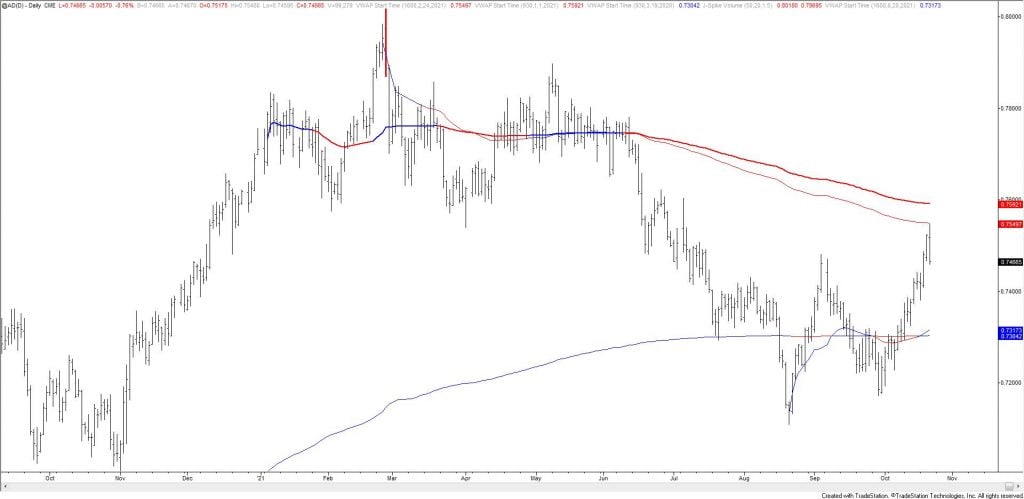
AUDUSD DAILY
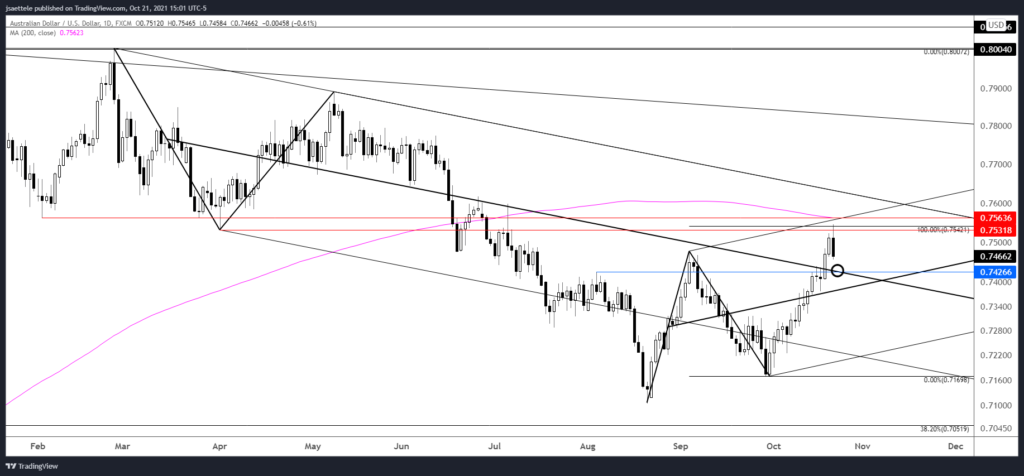
AUDUSD reversed sharply lower today from the proposed resistance zone. I don’t have a strong view on the importance of today’s high but near term downside focus is .**7420s. **However, the specter of VWAP resistance (see 2 charts down) and 2 equal legs higher from the low warrant respect for a more bearish outcome. Also, a J-Spike (reversal) unfolded with price under the 200 day average. Previous signals are shown in the chart below. Keep an open mind but risk is well-defined for bears after today’s action.
10/19 – Commodity FX has been on an tear. AUDUSD tagged the September high today so we could get a pullback. If we do then watch for support near .7425, which is the center line of the channel from the February high (this line was resistance in June). More important resistance isn’t until .7530/60. This level is loaded with the February and April lows, 2 legs up from the August low, the 200 day average, channel resistance, and VWAP resistance (see futures chart below).
AUDUSD DAILY
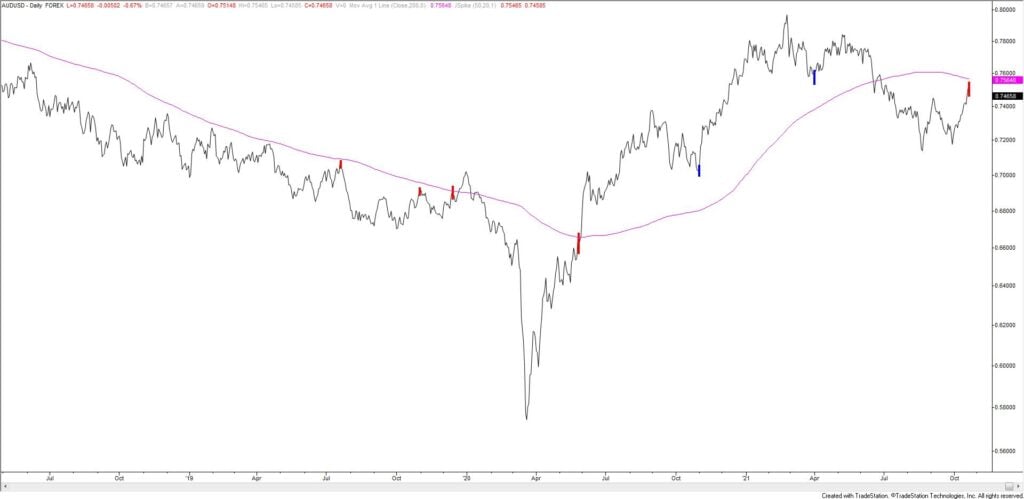
AUSTRALIAN DOLLAR FUTURES DAILY
USDCAD DAILY
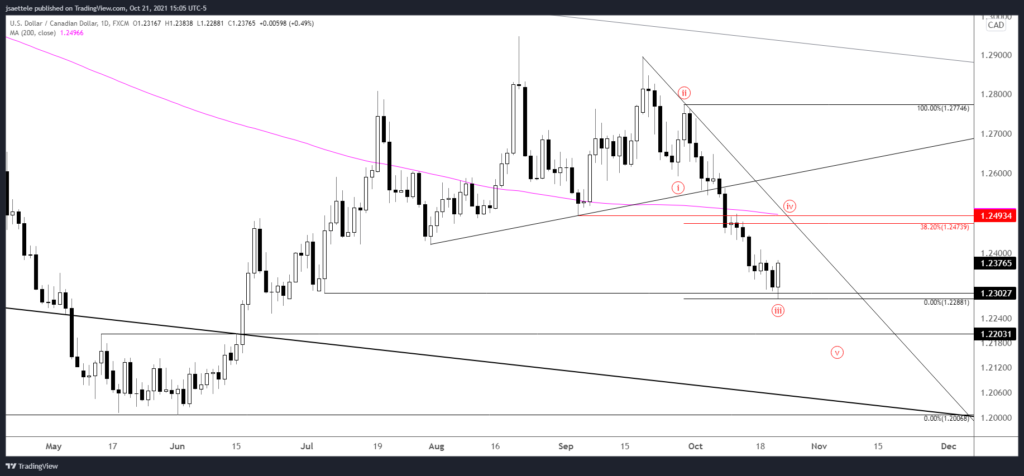
USDCAD put in a bullish outside day today. I’m of the mind that today’s low marks the end of wave 3 within a 5 wave drop from the 9/20 high. Ideal resistance is 1.2473/94, which is the 38.2% retrace of proposed wave 3 and the September low.
10/19 – USDCAD has spent 4 days trading around the 61.8% retrace of the rally from the June low. Also, today’s long lower wick and 4 hour volume reversal (see below) suggest that a relief bounce could take hold. With resistance probably not until 1.2490s, I’m willing to trade the long side against today’s low.
EURUSD HOURLY
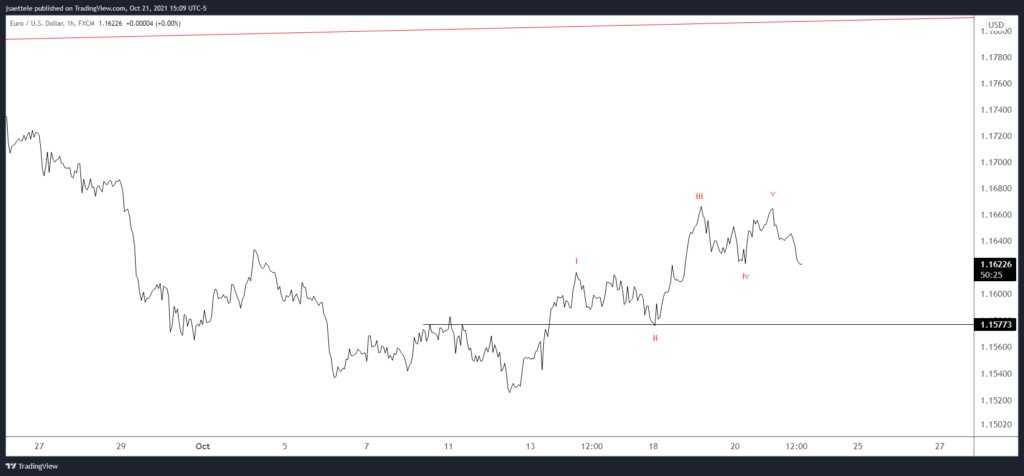
The EURUSD rally from last week’s low satisfies requirements for a 5 wave impulsive advance. Wave 4 cannot overlap wave 2 is an Elliott impulse rule. R.N. Elliott plotted his charts on hourly closing data…so the rules should be interpreted on hourly closing data! As such, I’m treating the rally as an impulse and looking for a 3 wave pullback before another leg higher. Proposed support is 1.1570/80.
10/18 – FXE (euro ETF) completed a 2 week volume reversal last week. Volume was over 2 x the 13 week average both last week (up week) and the prior week (down week). This setup has only occurred 2 other times (circled on the chart). Both times were within weeks of major turns. I’m willing to trade the long side against today’s low, which is defended by the month open at 1.1578.
AUDJPY 4 HOUR
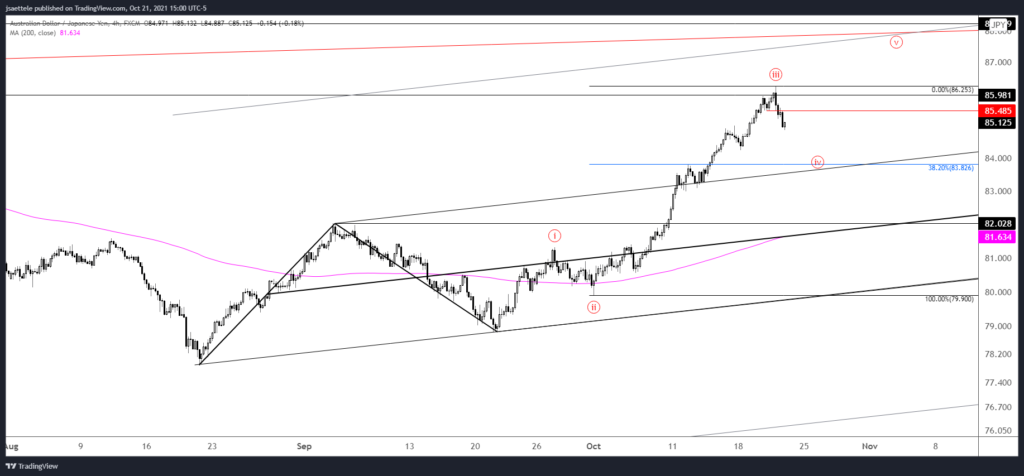
Today’s AUDJPY high is probably the end of wave 3 within the 5 wave rally from the 9/22 low. Ideal wave 4 support is the 38.2% retrace of wave 3 at 83.83. This intersects with the top side of former corrective channel resistance. In other words, support is well-defined. Near term proposed resistance is 85.49.
10/20 – AUDJPY daily RSI also closed right at 82.79 on Wednesday (the exact same reading as CADJPY). Readings this high are rare. Here’s the list – now, 2/24/21, 9/5/2014, 12/18/12, and early December 2005. Even the 2012 instance led to a 3 day pullback. Bottom line, RSI is in ‘rarefied air’ and therefore at risk of a snap back. I’ll alert in the event of reversal evidence. The historical charts are shown below.