COPPER FUTURES 4 HOUR
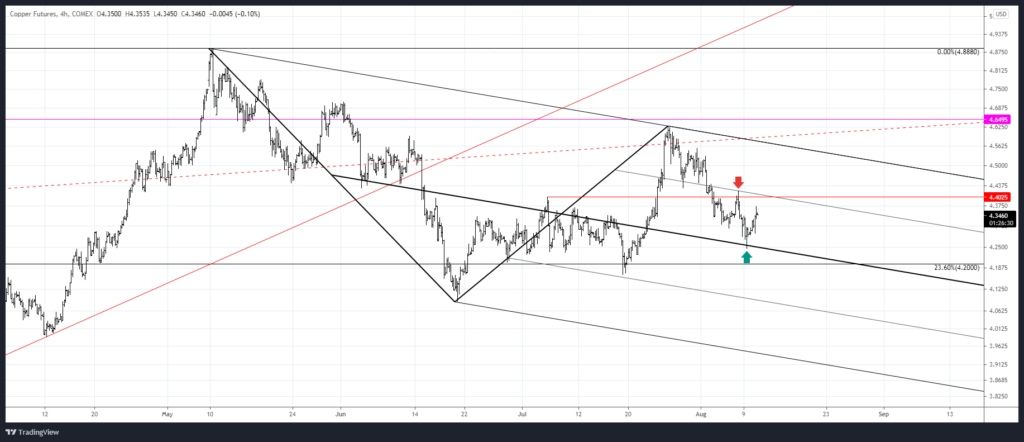
Copper bounced off of the center line of the channel from the May high on Monday. The center line validates the channel. Further, the 25 line was recently resistance. That line intersects the 7/6 high at 4.4025, which is now proposed resistance. Bottom line, evidence suggests that copper is in a downtrend.
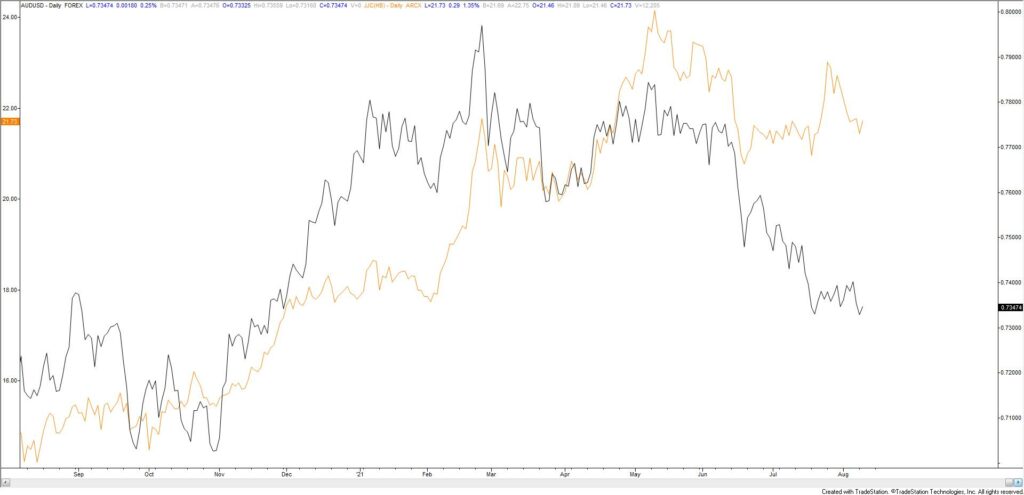
COPPER (ORANGE) AND AUDUSD (BLACK) DAILY
AUDUSD HOURLY
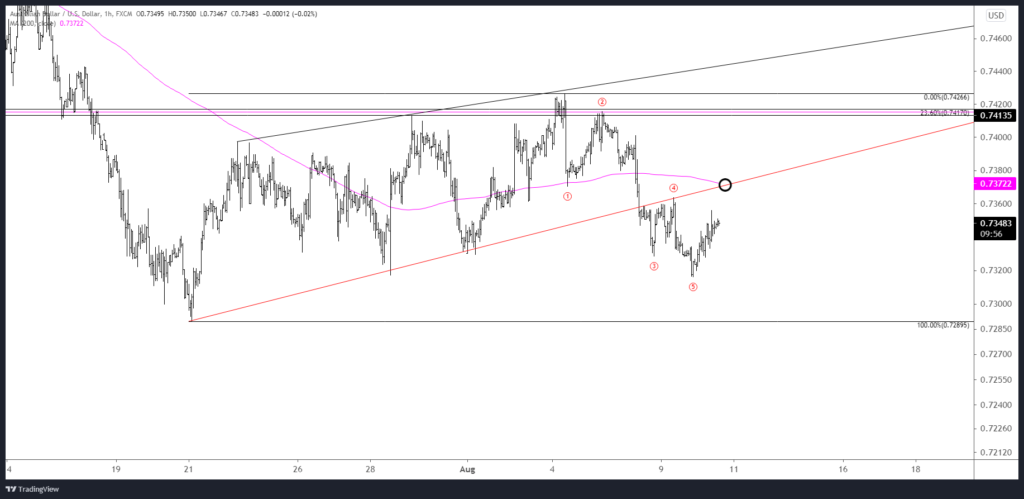
Copper and AUDUSD tend to move together (see above), which reinforces the bearish AUDUSD view. With 5 waves down in AUDUSD from 8/4, today’s bounce is viewed as corrective. .7370 is well-defined for resistance and a short entry.
8/9 – AUDUSD has broken the wedge barrier so focus is lower until noted otherwise. As noted the downside objective is .7150 but .7030/50 is a bigger ‘chart level’. Maybe we get a ‘flash crash’ type of move into this level (similar to metals) before a more important low is in place. The underside of the wedge is proposed resistance at .7360.
NZDUSD 4 HOUR

NZDUSD reversed just before .6960 but 5 waves down from the 8/4 high keeps the bearish view on track. .7040 is the 61.8% retrace and daily reversal resistance…watch that for resistance now. From an extremely short term point of view, .6990 or so may provide support for a small B wave.
8/4 – NZDUSD reversed right at the 25 line (as suggested) today. Downside focus is the center line near .6960. This level intersects the lower parallel from a shorter term bullish fork. Action at that lower parallel will help determine whether we should expect additional upside/range trading or if we should expect a break to new lows sooner rather than later.
USDCAD 4 HOUR
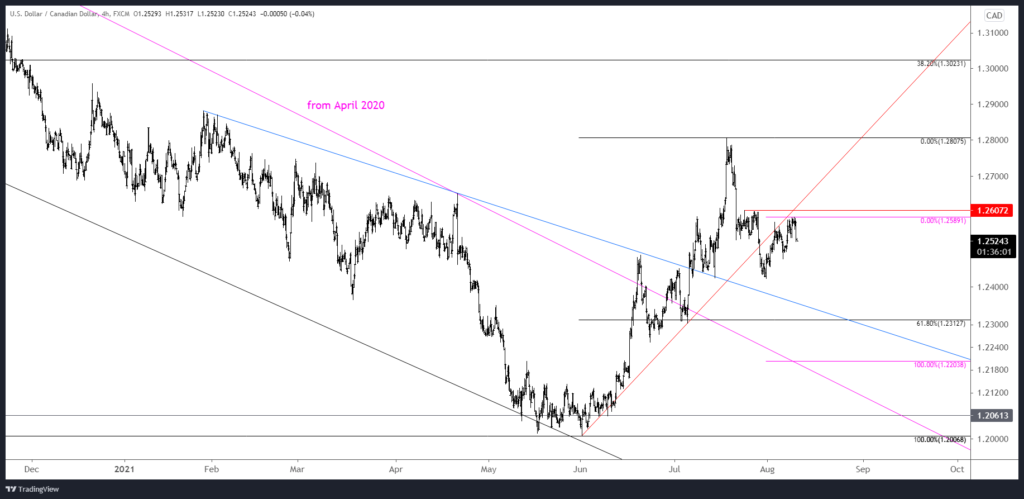
USDCAD has responded to noted resistance (VWAP and the trendline), so focus is lower. A downside level of interest is the 61.8% retrace of the rally from the June low at 1.2313. That level intersects the trendline from late January, which was support in mid-July. In other words, the line is well-defined.
8/9 – If the USD is going to pull back (see USDOLLAR above) then USDCAD is a good way to play the move. USDCAD is testing the underside of the former trendline (again). I’m on reversal alert. Also, seasonal tendencies are now negative (see below) and futures are testing VWAP support (USDCAD resistance…see 2 charts down).
AUDCAD DAILY
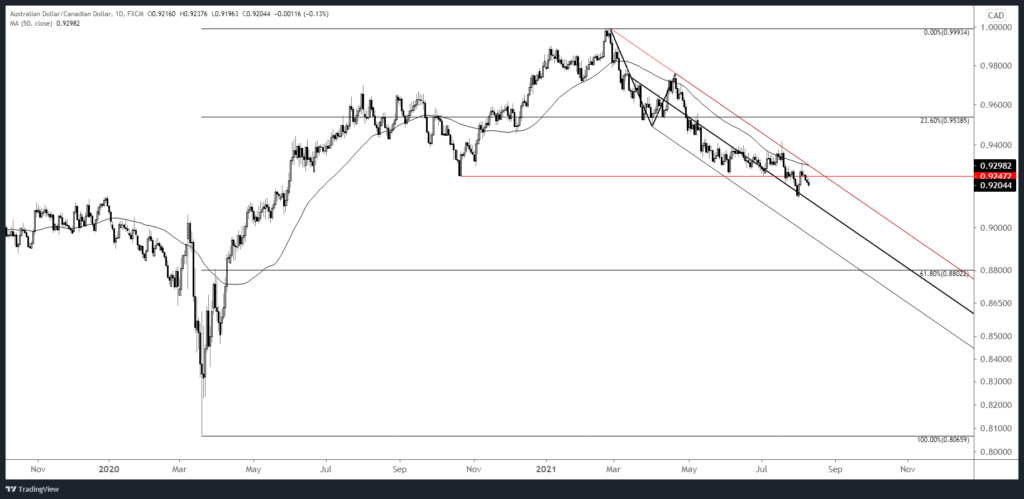
Bearish view on AUDUSD, NZDUSD, and USDCAD seem contradictory so one of these views may be wrong. However, I can imagine a scenario where this works out. AUDCAD remains within a bearish channel and the cross reversed lower from the 50 day average a few days ago. Continuation lower within the channel would be consistent with both AUDUSD and USDCAD declining (maybe NZDUSD too?). Let’s see!
USDJPY DAILY

First, USDJPY broke above trendline resistance. Remember that this occurred after a daily volume reversal in Yen futures. The combination is extremely bearish Yen (USDJPY bullish). Eventually, the top side of the trendline (blue line) is proposed support. If price is going to pull back, then 110.70-111.00 should provide resistance (the top of the range is daily reversal resistance and the March high).
8/4 – The 25 and 75 lines nailed BOTH the high and low today for USDJPY. I’m willing to buy into the center line near 109.15 given the daily volume reversal today (see futures chart below). Near term upside focus is the upper channel line near 110.00.