Education
June 11, 2021

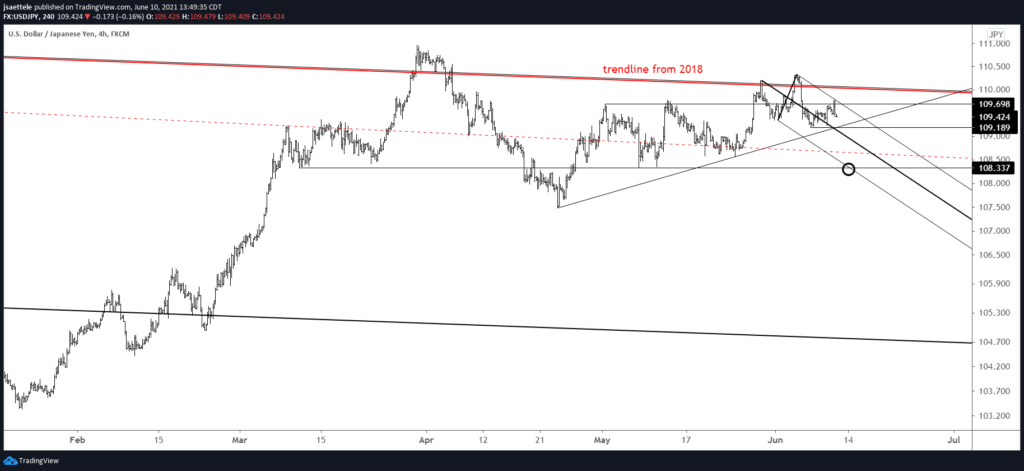
109.20 is the breakdown level in USDJPY now but there is a well-defined bearish fork in place and today’s high at 109.80 is at a well-defined horizontal level. As such, I’m bearish against today’s high and looking towards 108.34 initially.
June 10, 2021
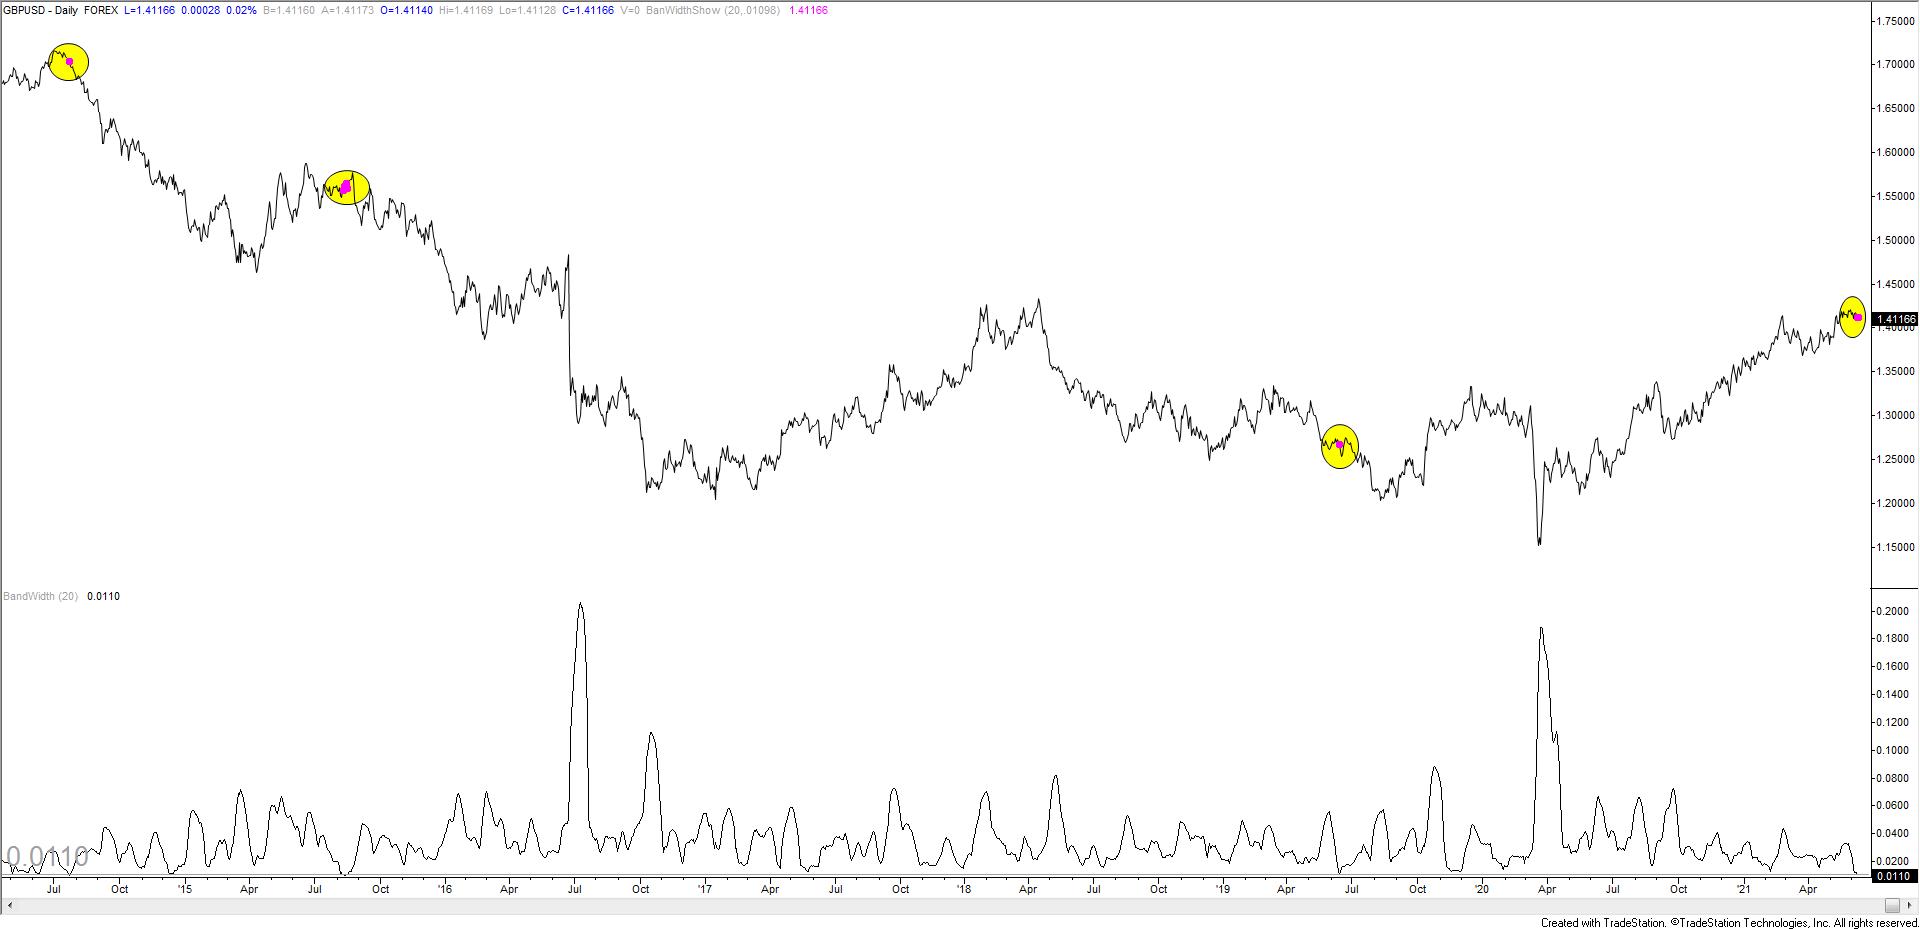
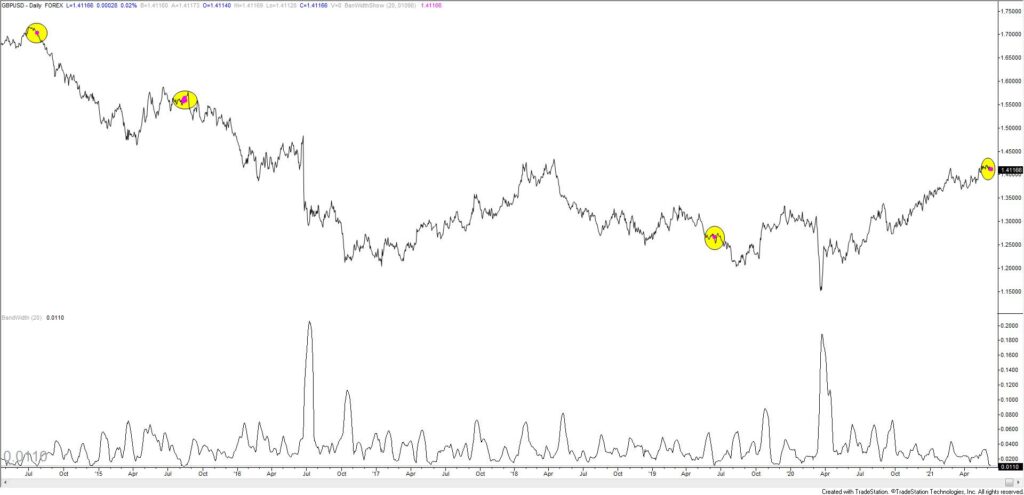
Daily Bollinger Band width for GBPUSD is extremely low. The reading is towards the lower end of its historical range. Readings this low are shown with magenta dots. Although BB width is not a directional indicator, extremely low readings have occurred before sharp declines. This makes sense since extreme complacency (as indicated by narrow Bollinger Bands) occurs at USD lows.
June 9, 2021

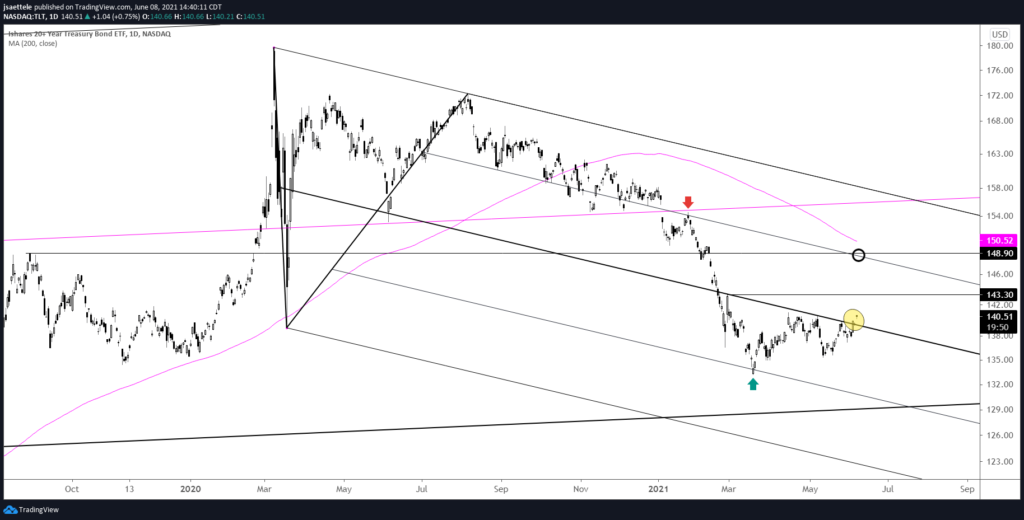
TLT gapped higher through the median line today. This is typical price behavior around a median line. Focus is higher towards 148.90 (give or take). Remember, higher TLT means lower rates. This can (not always) correlate with risk aversion and lower Yen crosses in FX.
5/25 – After pulling back from the early April high, TLT found support at the 61.8% retrace of the rally. Price is again at the median line from the channel that originates at the March 2020 high. Markets tend to exhibit heightened volatility around median lines. I’m on the lookout for a surge higher. I’ll address implications for FX and equities if we get a strong TLT (bond) move.
June 8, 2021
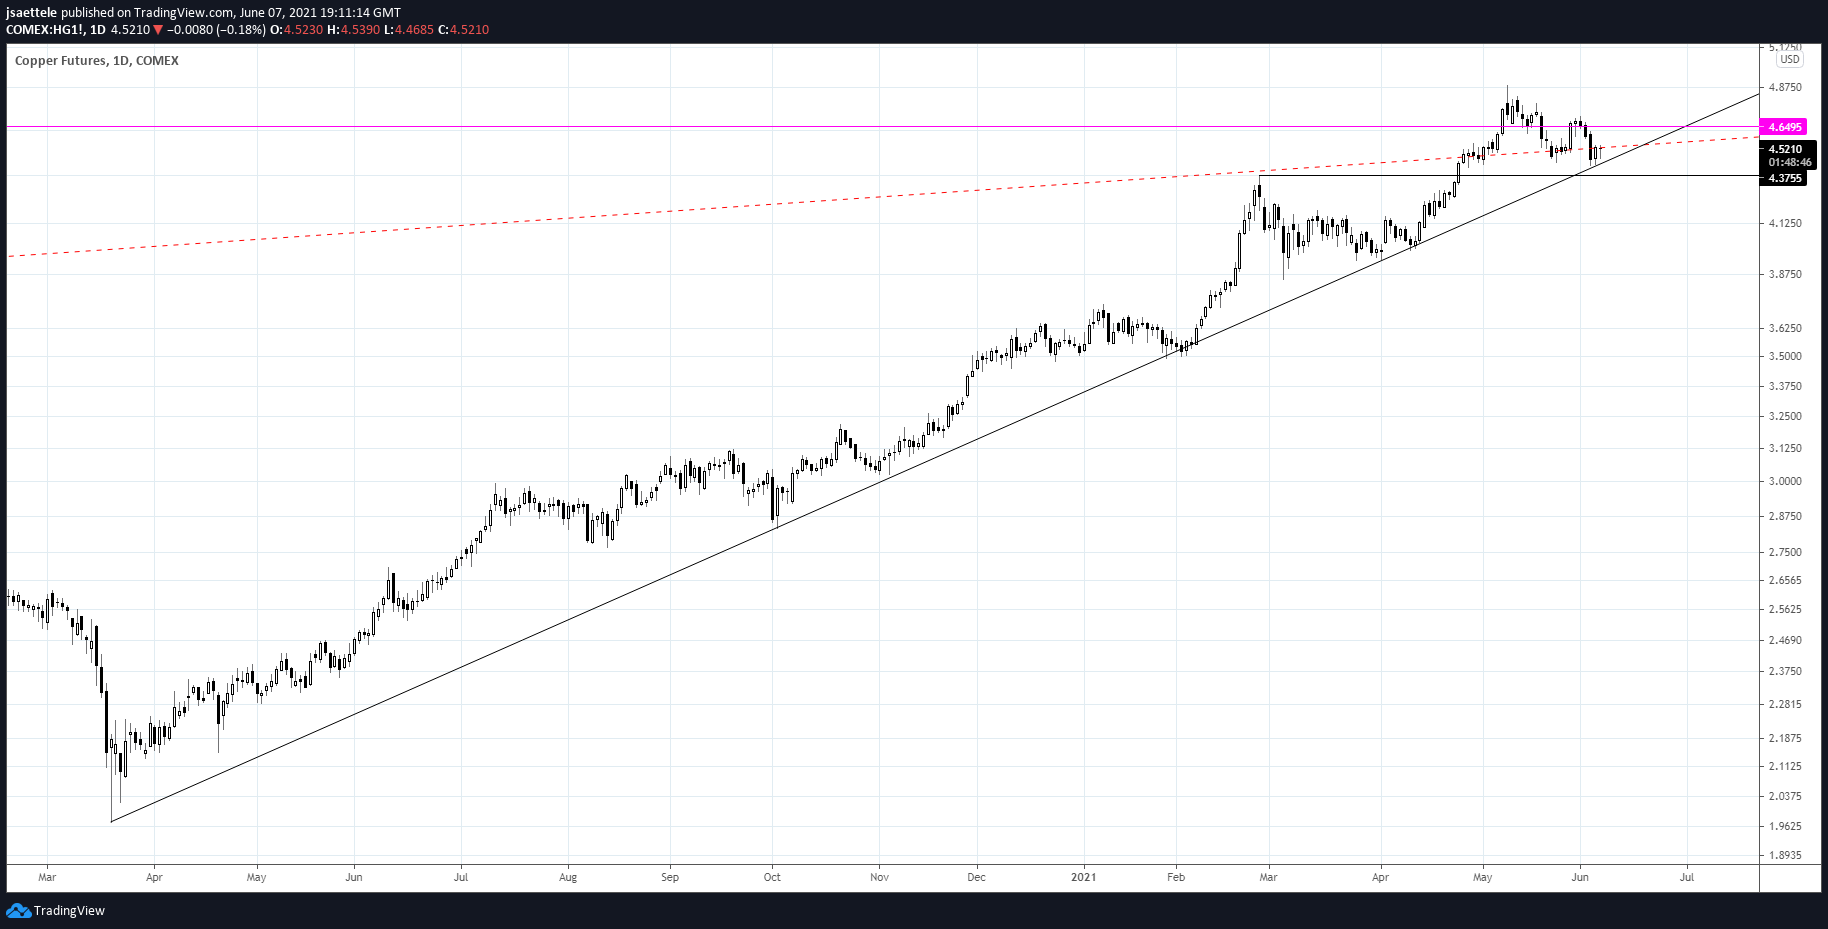
Copper is at 14+ month trendline support. A break below would indicate a significant behavior change and usher in the largest decline since the rally started in March 2020. The long term picture is below.
5/24 – After trading to an all time high 2 weeks ago, copper put in a weekly reversal candle. Price followed through on the downside last week as well. This raises the specter of a massive failure after the move above the 2011 high. A close up view is below.
June 4, 2021

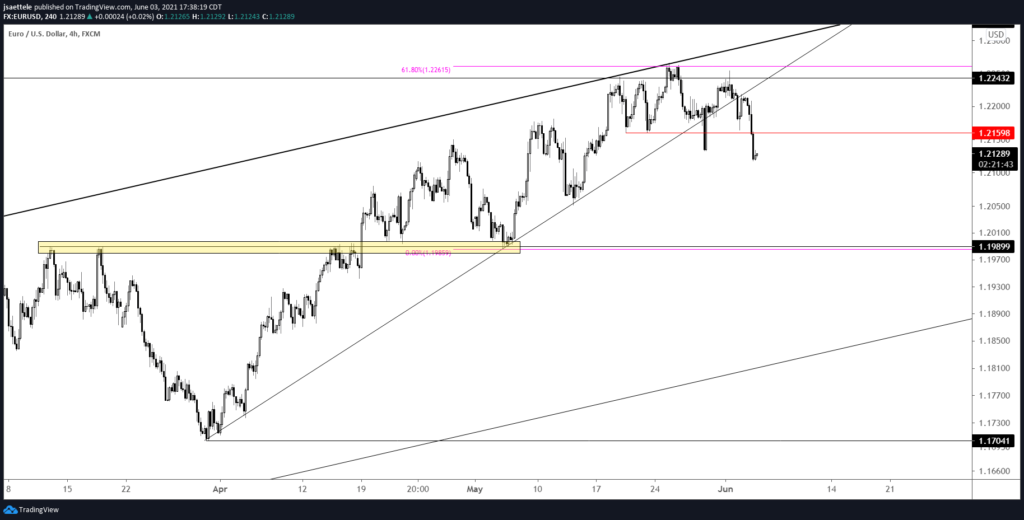
EURUSD has broken down and near term focus is 1.1990 (see highlighted zone). Resistance should be 1.2160. Eventual downside is the lower parallel of the channel that originates at the March 202o low. That line is about 1.1850.
June 3, 2021

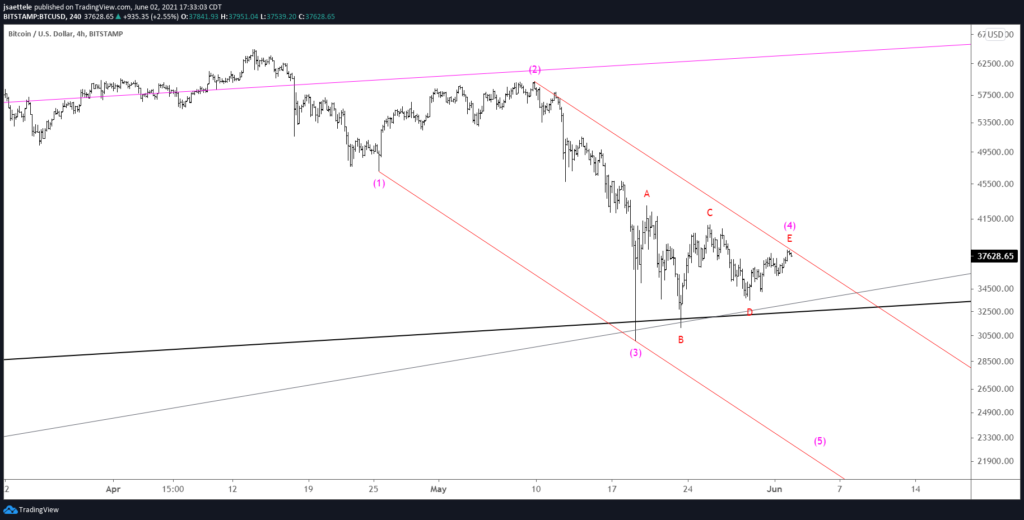
BTCUSD may have completed a 4th wave triangle within a 5 wave decline from the April high. The decline channels in perfect Elliott form and proposed wave 4 has traced out a well-defined triangle. If the proposed interpretation is correct, then BTCUSD is lower from the current level (this pattern negates above 40904).
5/19 – BTCUSD tagged the 32000 level (low was 30000) and snapped back but I don’t think this is the low. Notice where the snap back rally stalled…right at the underside of the former channel line (magenta channel). This is the ‘slingshot’ setup that I’m so fond of. If strength resumes then VWAP levels to know for resistance are 44400 (2021 VWAP) and VWAP from the top, which is currently 50000. The ultimate support is 19666, which is the 2017 high and the 25 line of the channel that we’ve been following. Recall that we turned bearish in February at the 75 line because the rally materialized at the 25 line. This is knows as median line symmetry (see daily chart below)!
June 2, 2021
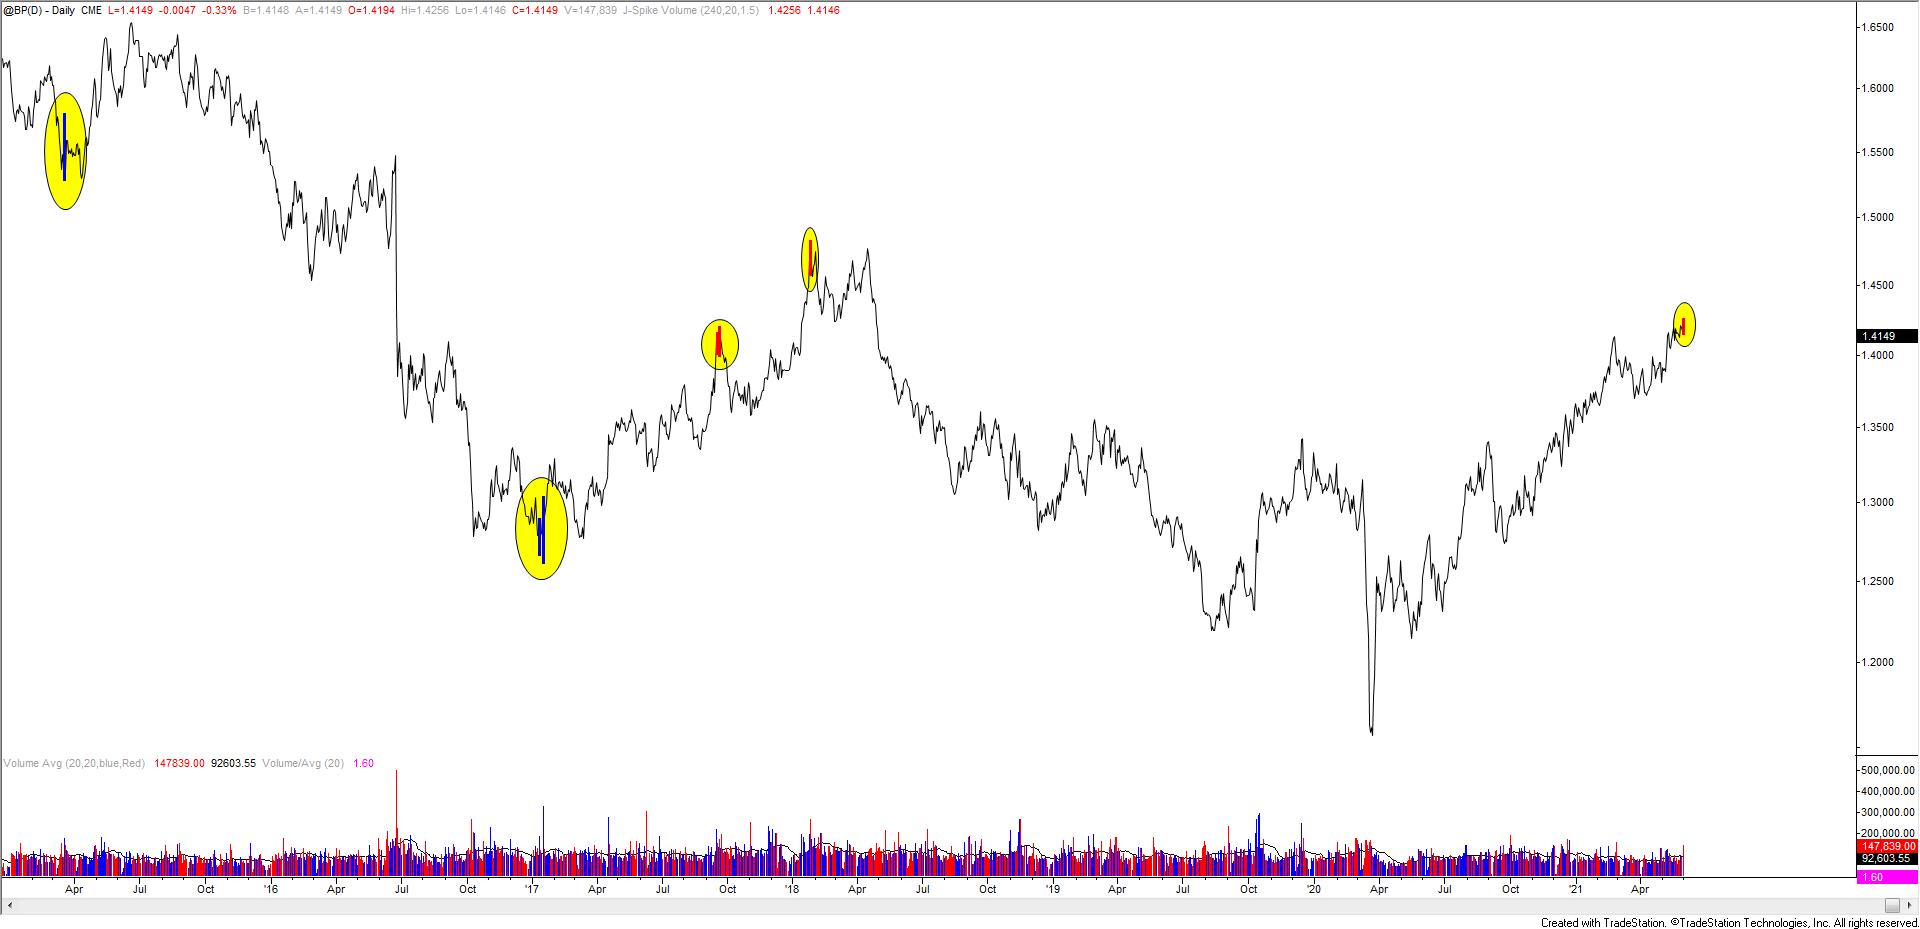
Pound futures made a daily volume reversal today. The signals shown are at least one year high/lows with at least 1.5 x the 20 day average volume. Those are some timely signals. Price is testing the center line of the channel from the April low (see spot chart below). In the event of a bounce, resistance is 1.4210. Near term downside focus is the lower parallel, currently near 1.4005.