DJI WEEKLY
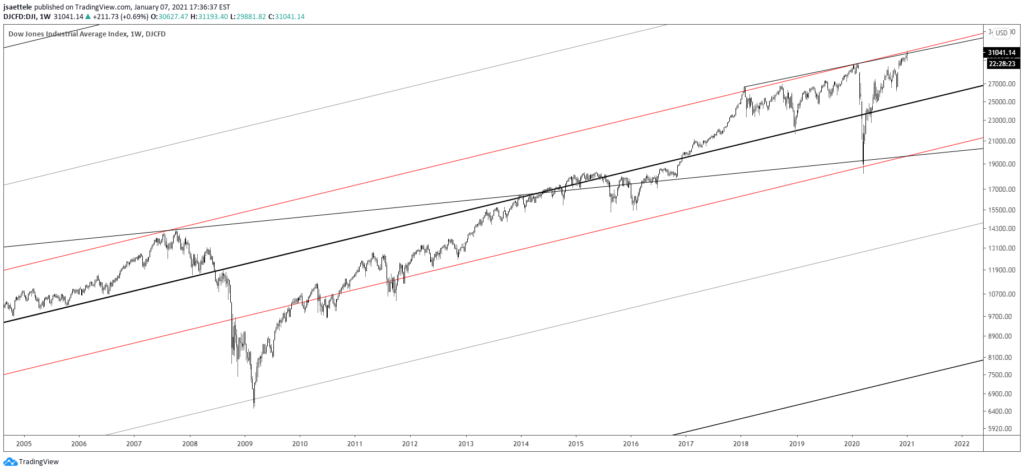
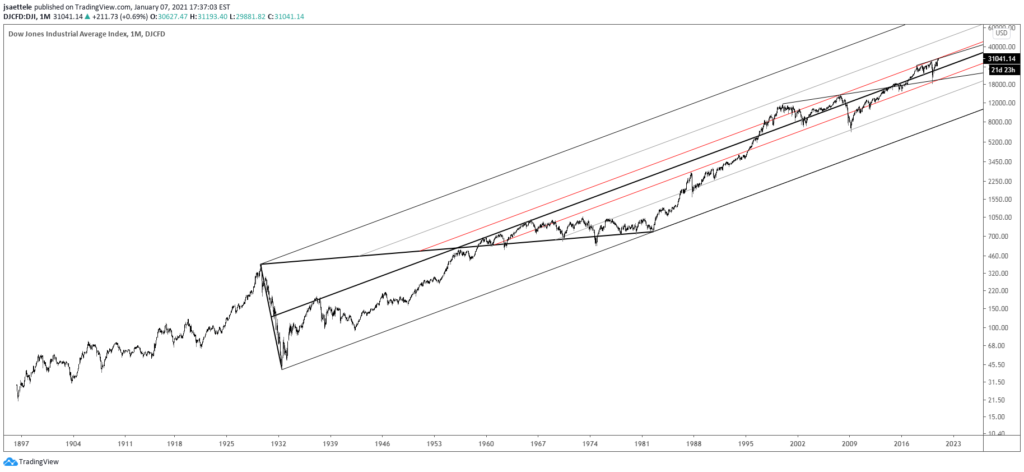
The Dow has reached the LONG TERM parallel that crosses the 2007 high, January 2018 high, and February 2020 high. The parallel is based on the line that connects the 1932 and 1982 lows. The chart in its entirety is shown below. Major level!
DJI MONTHLY
USDOLLAR DAILY
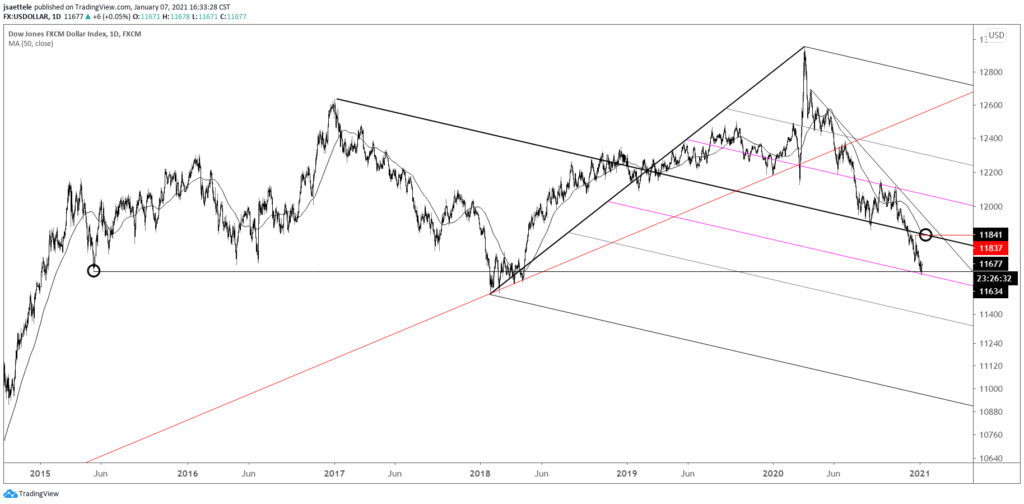
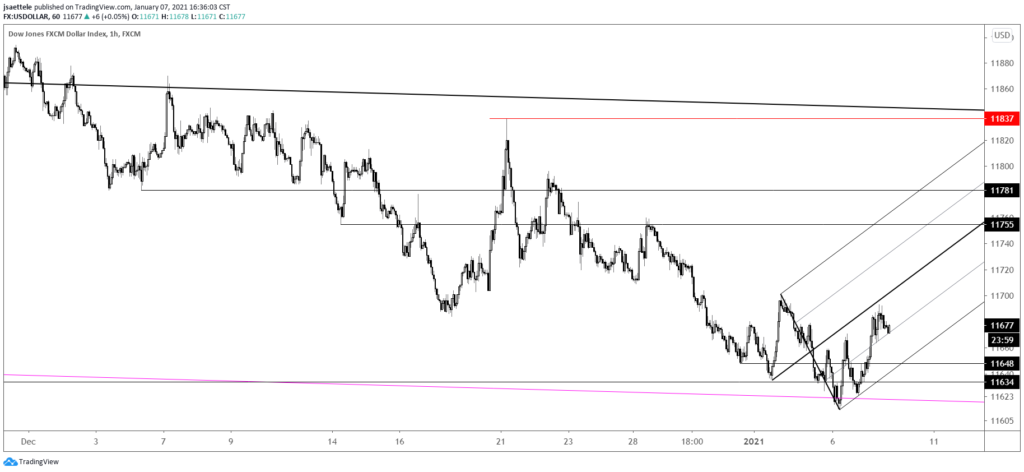
USDOLLAR continues to hold the May 2015 low. The level is also defined by a parallel that is equidistant from the parallel that was resistance in September and November (magenta lines) when measured from the median line. This is an example of symmetry that we often see in median line analysis. I am looking towards the median line, about 11840, as long as the low holds. A short term structure is shown below that is in play and worth following. 11650 is possible support.
1/4 – Today’s USDOLLAR low…11635. Price reversed sharply higher after low print. UUP, the USD ETF, made a high volume reversal today. The only other volume reversal on the first day of the year was in 2017, which was a high. This is only the 4th bullish reversal since inception of the ETF. The previous 3 worked. Those charts are below.
USDOLLAR HOURLY
USDJPY 4 HOUR
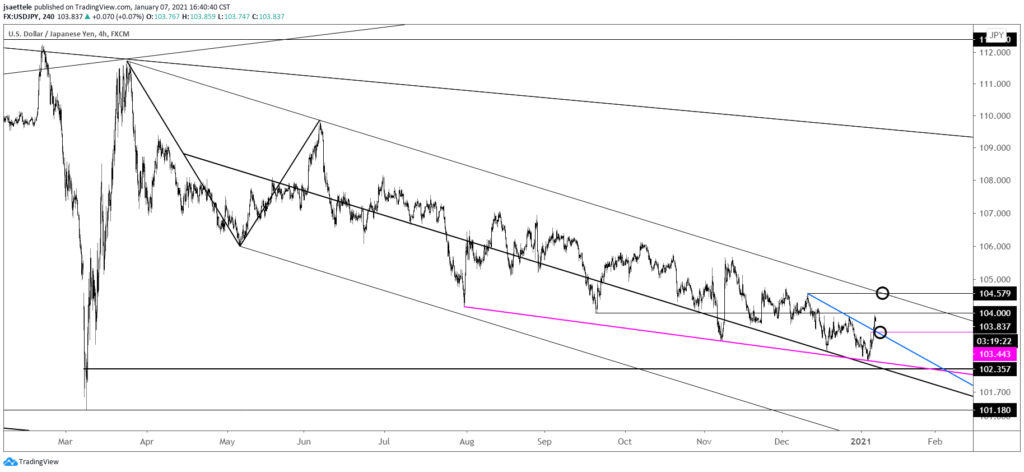
USDJPY has turned sharply higher this week and will likely made a weekly J-Spike. If volume is sufficient tomorrow, then a weekly volume reversal is possible as well. I like that price turned up from the line that connects the July and November lows. 104.00 is viewed as a reaction level and proposed support is now 103.40s. The big test for bulls is the upper parallel of the channel from the March high at 104.50s.
USDCAD WEEKLY
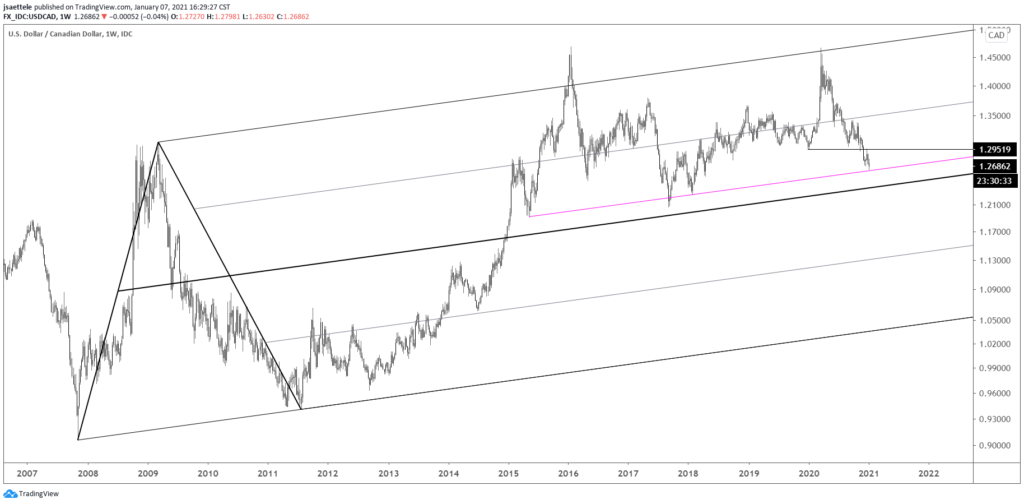
USDCAD low on Wednesday was at a major parallel. The parallels are based on the line that connects the 2007 and 2011 lows. This is an example of ‘original slope’, which is often the most important angle to base parallels. For example, notice that the upper parallel nailed the 2019 high. I don’t see any near term setup for entry but strength above 1.2800 would break the series of lower lows since 12/21 and shift focus higher.